
Deterministic Model and Stochastic Model
Deterministic Model
A deterministic model is a model that contains no random variables and always produces the same output for a given set of initial conditions and inputs. Its behavior is entirely predictable and without any element of chance.
Stochastic Model
A stochastic model is a model that incorporates random variables and elements of chance. Due to the presence of randomness, even with the same initial conditions and inputs, the model can produce different outputs, which are typically represented as a probability distribution of possible outcomes.
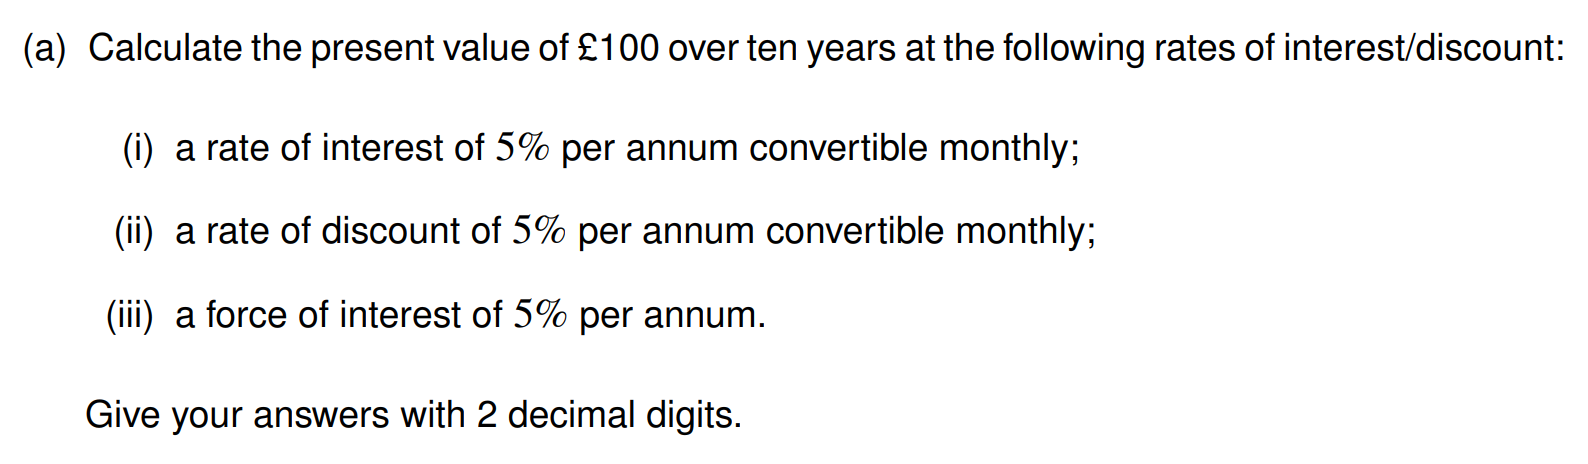
利息按期支付
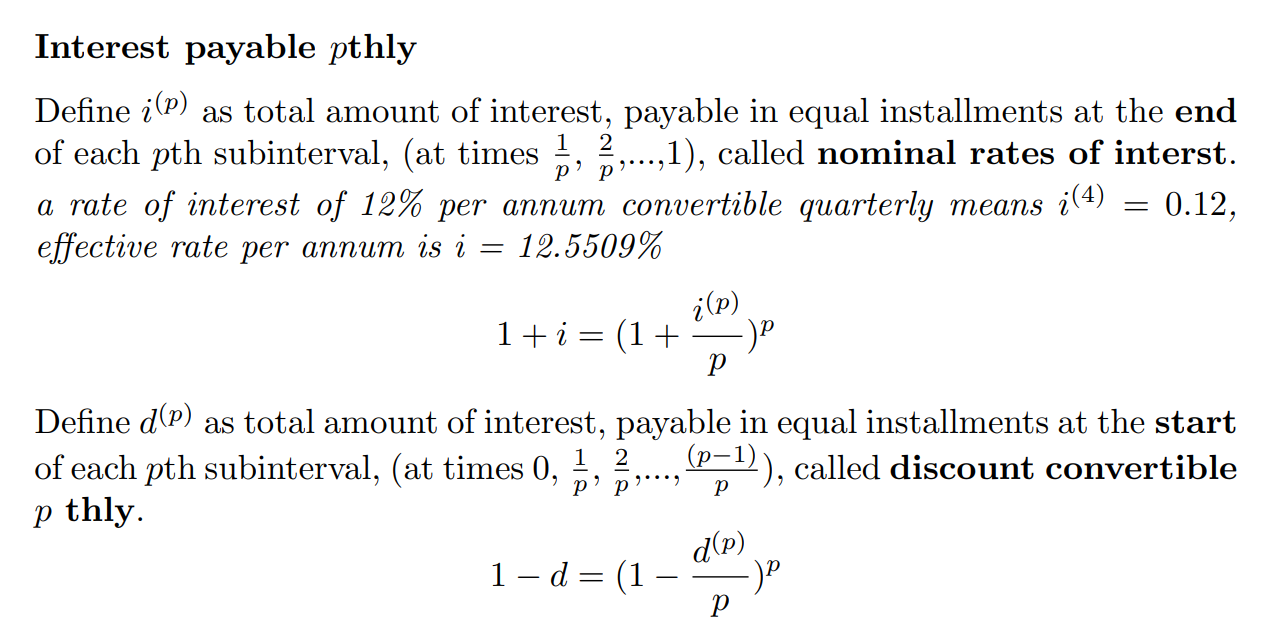
注意求解现值的时候:
- 已知
公式是 - 已知
公式是
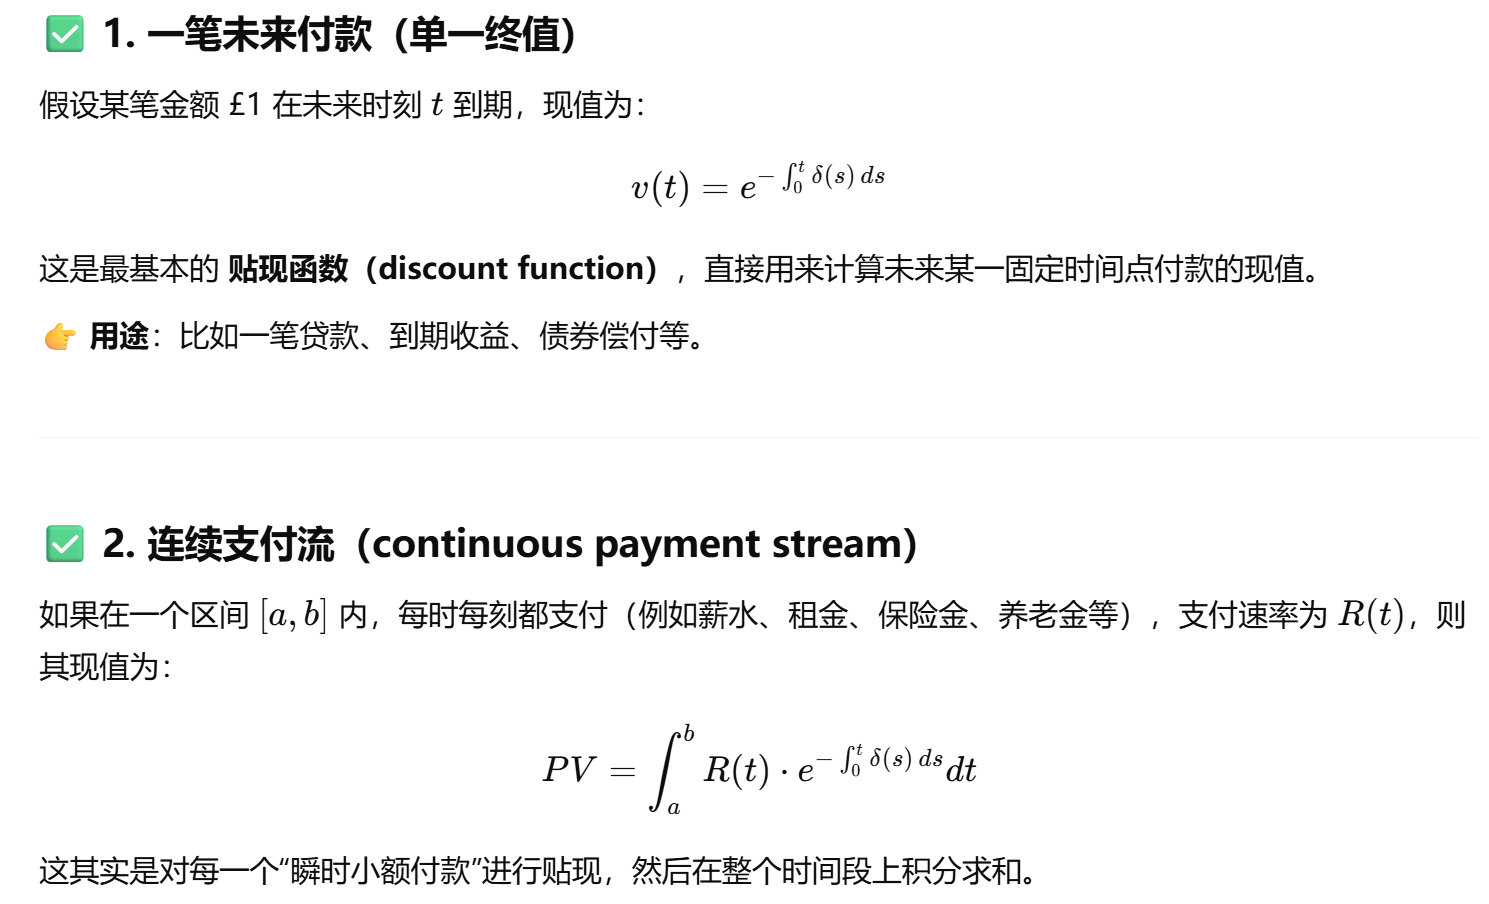
The force of interest
定义:
公式:
计算的时候用到的是A:以
If
考试例题:
mock例题
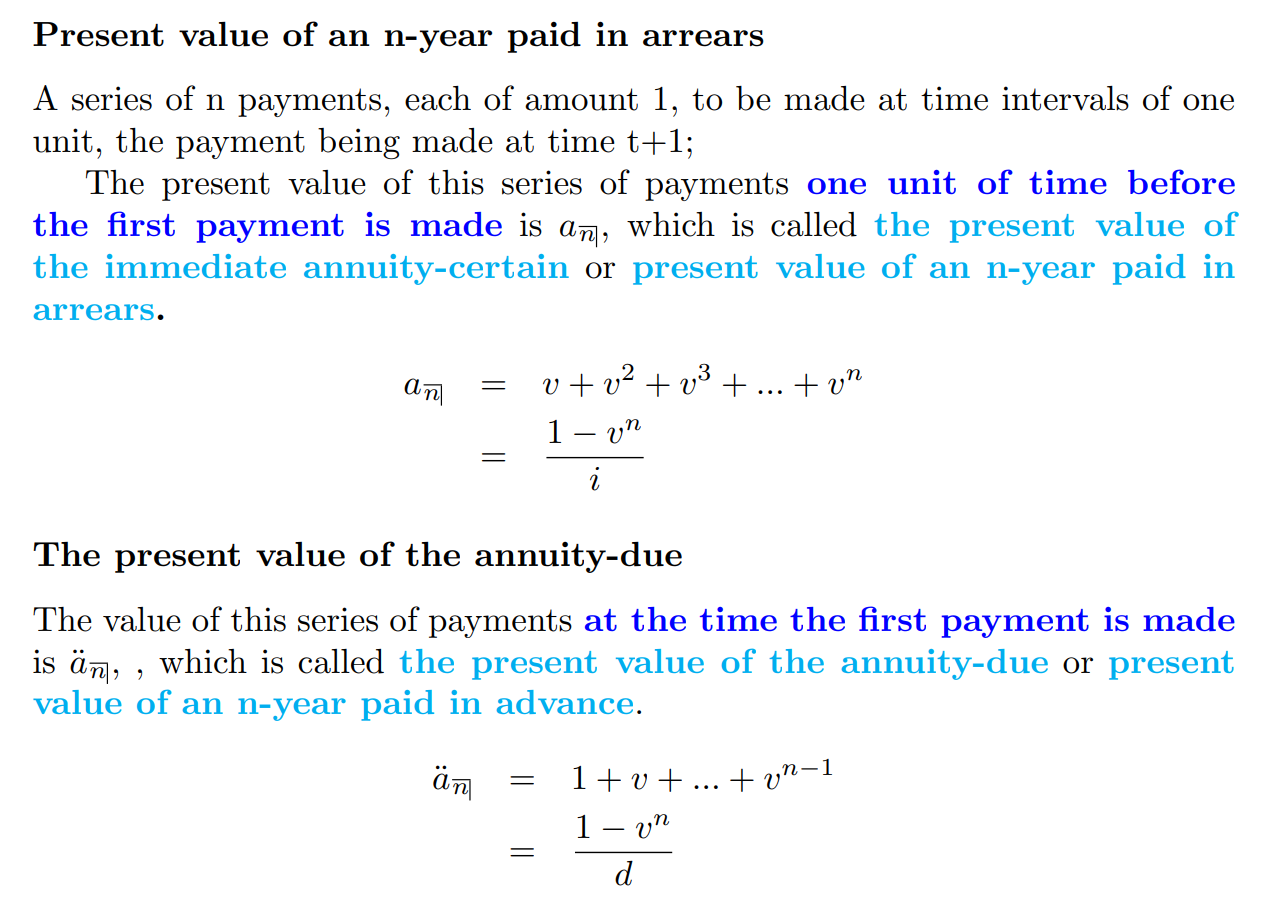
年金折现
in arrears or in advance
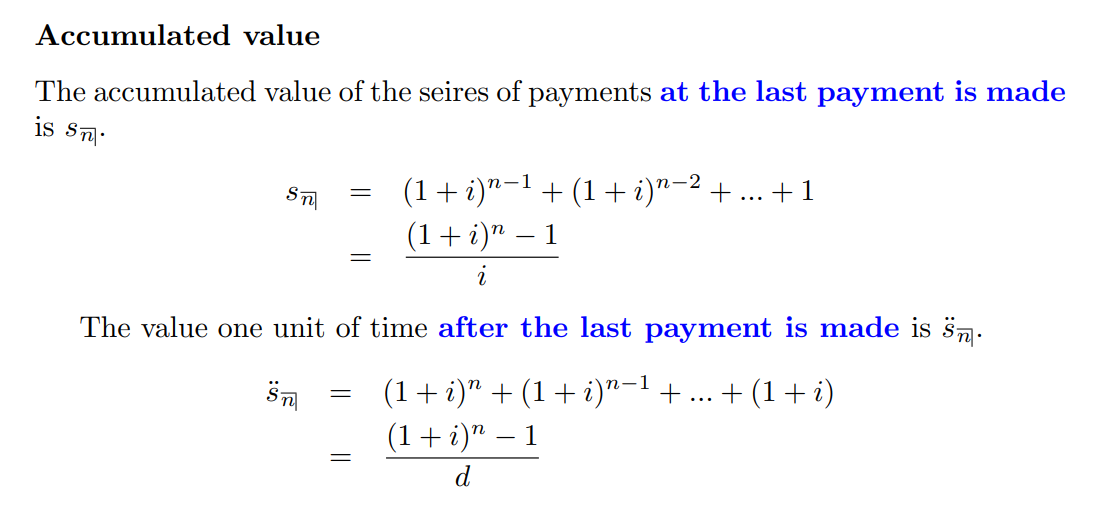
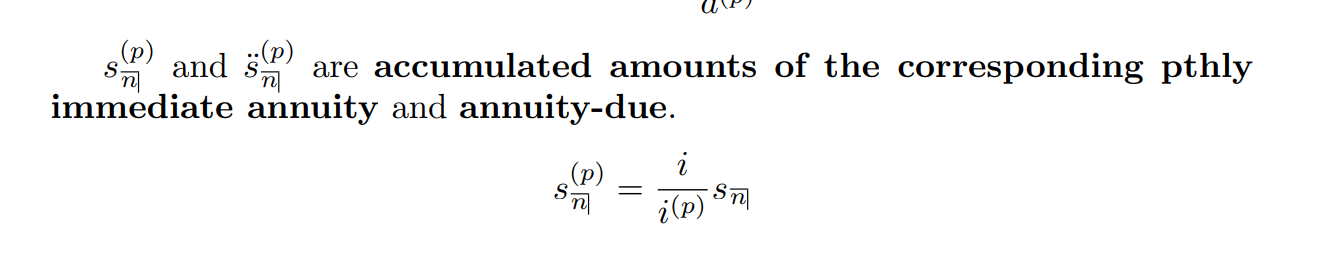
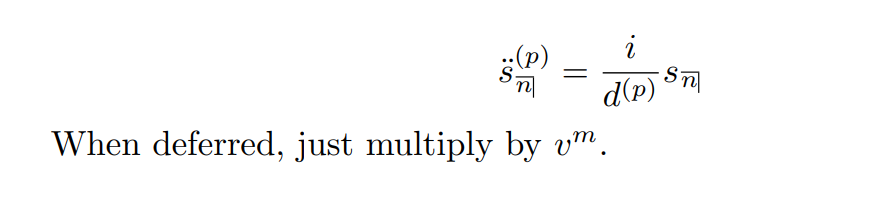
年金累积:
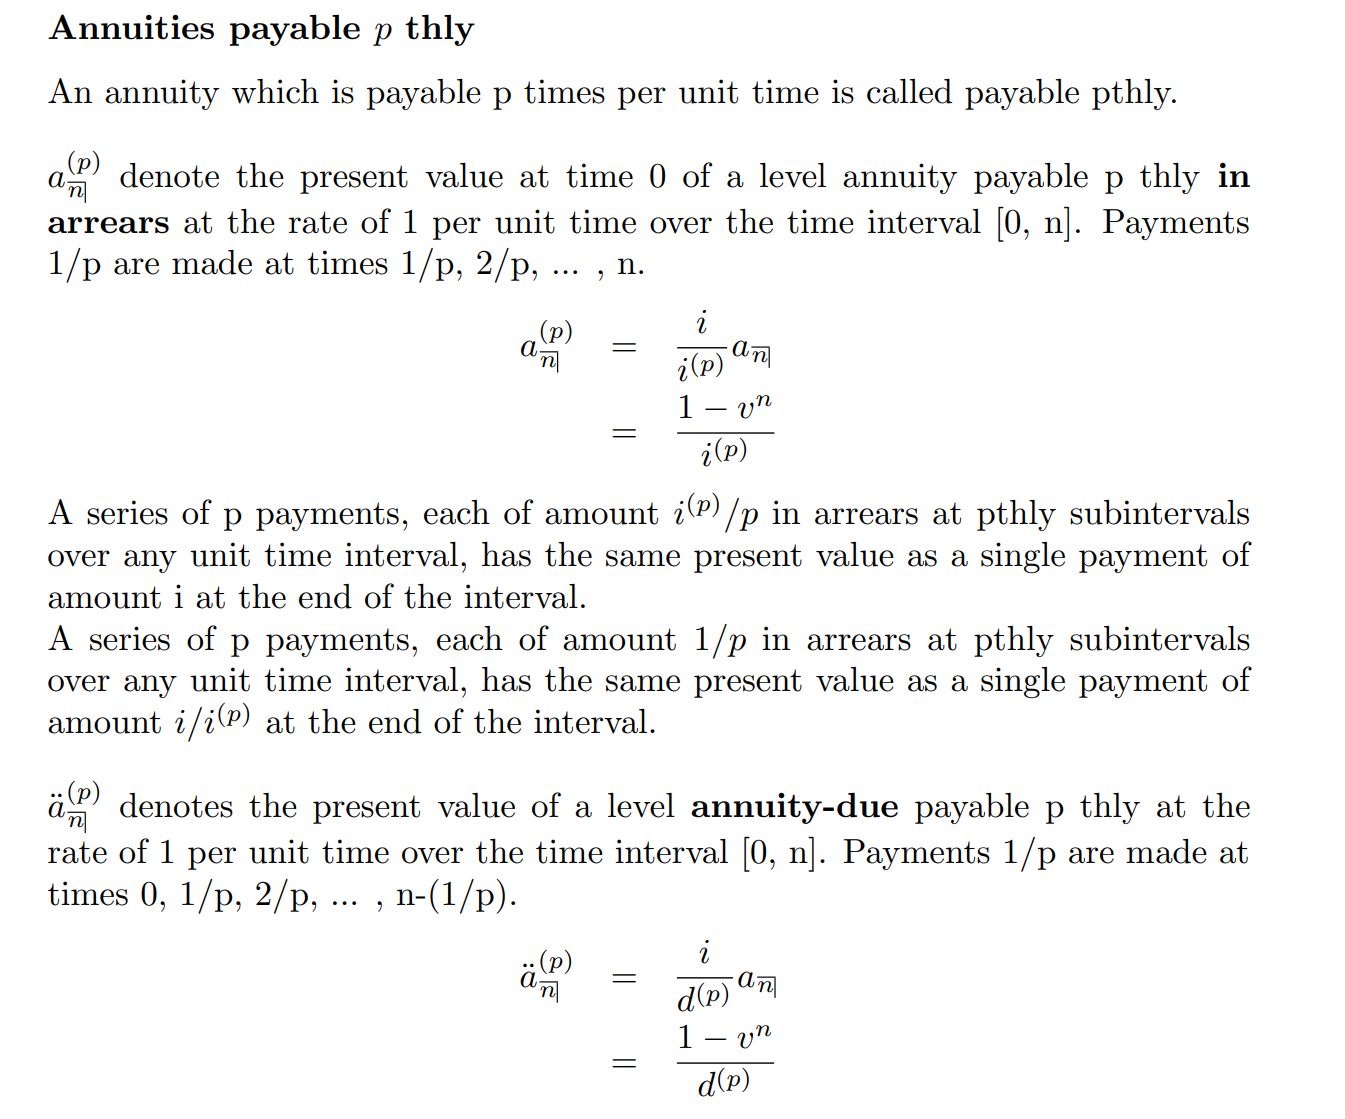
年金分p次支付
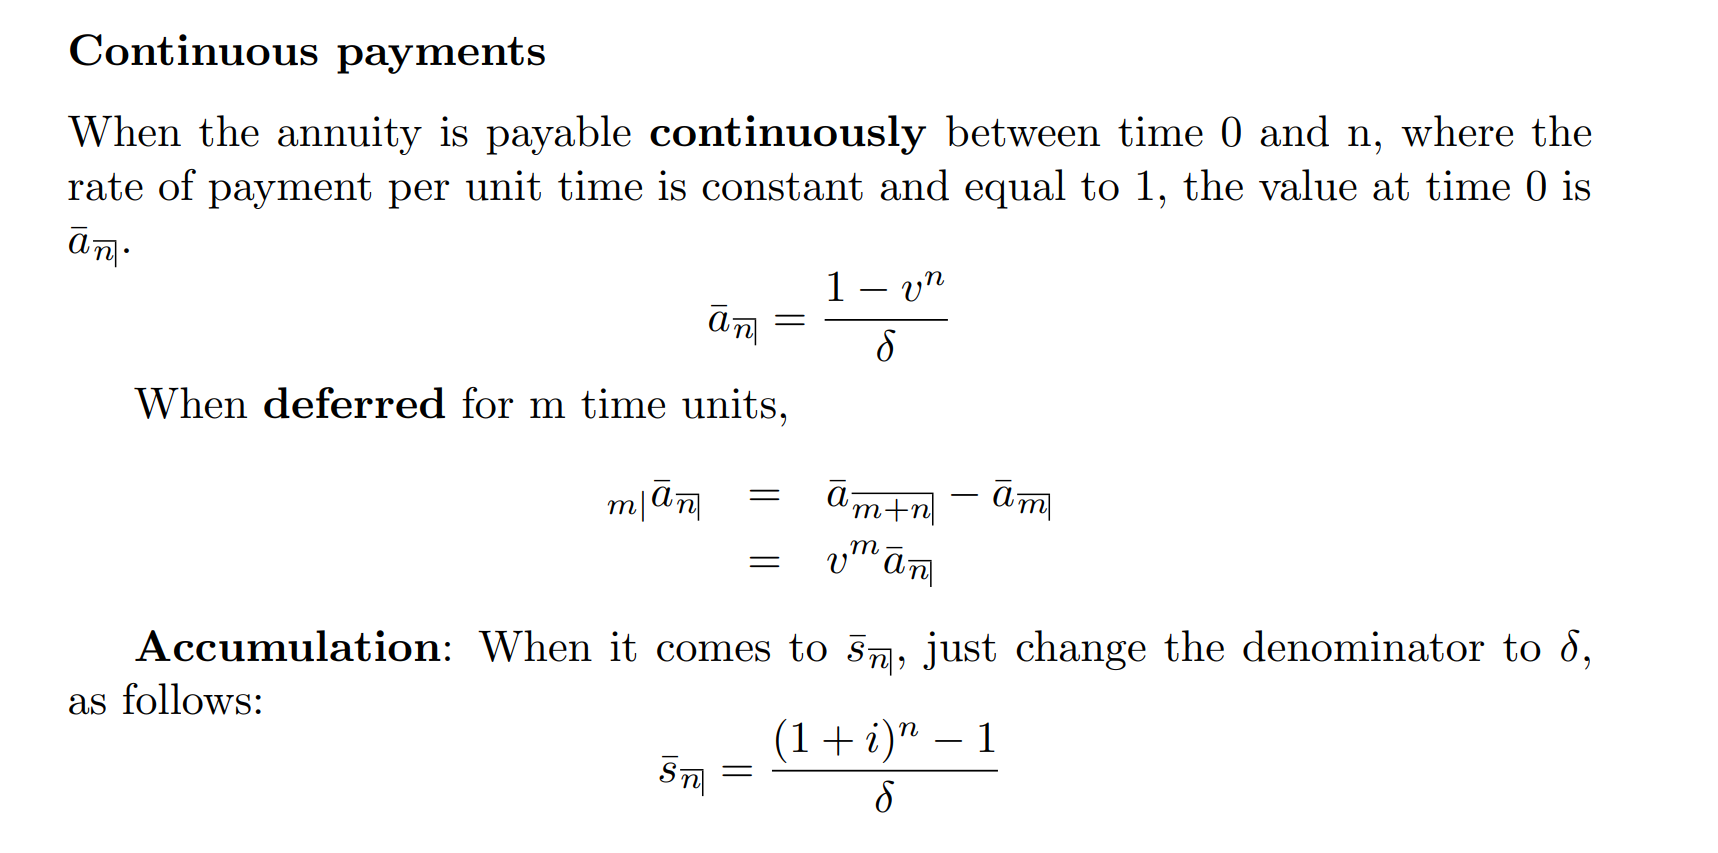
连续折现
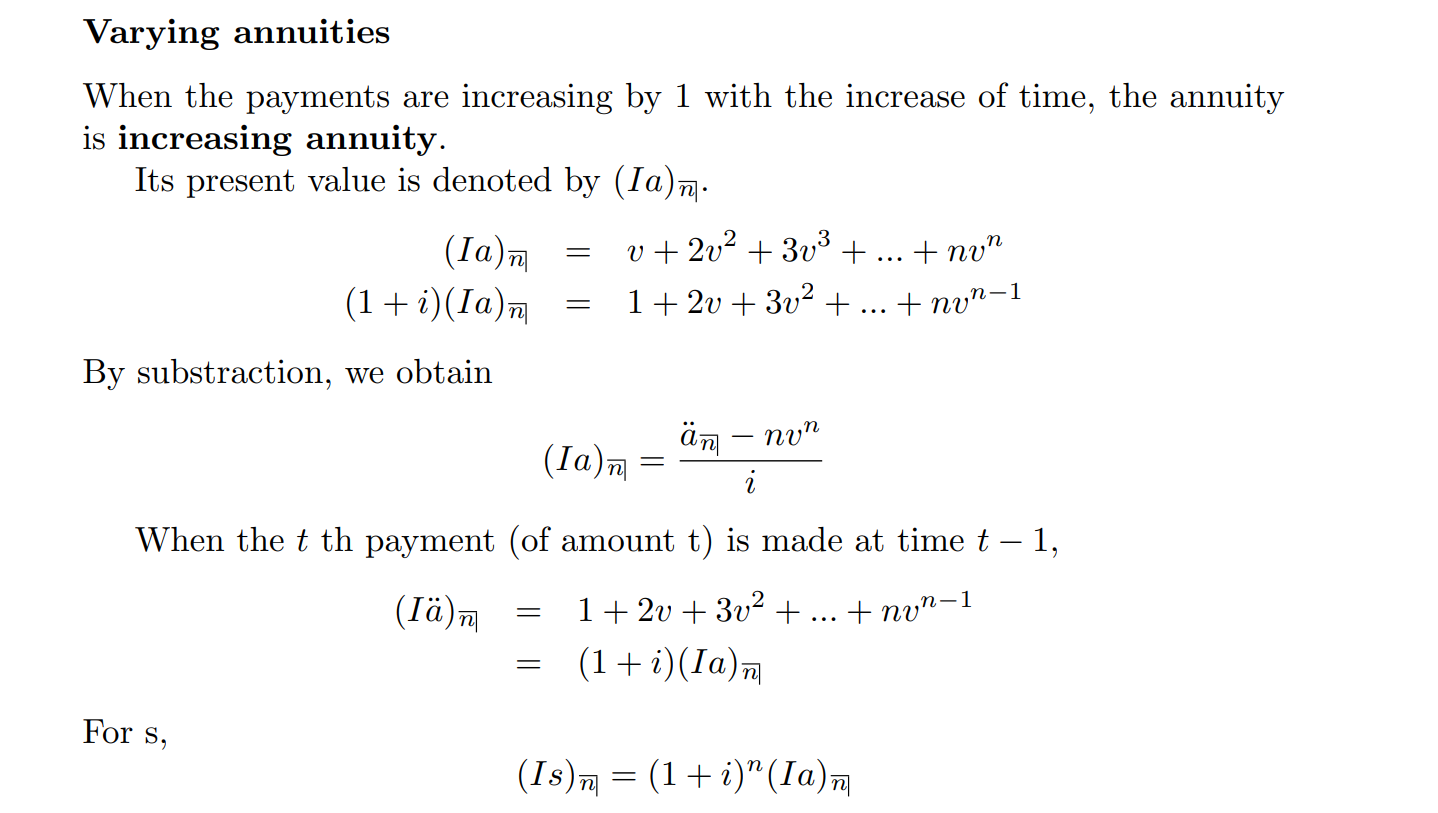
逐年递增
改动利率的情况
专业术语:
Reduced term 减少了的还款期限 原本20年,现在19年,reduced term =1
Reduced final instalment: 减少了的最后一期还款金额
举个例子:
固定每年还 £1,000
到第 18 年还完主要本金了,第 19 年只剩 £600 → 就是 reduced final instalment = £600
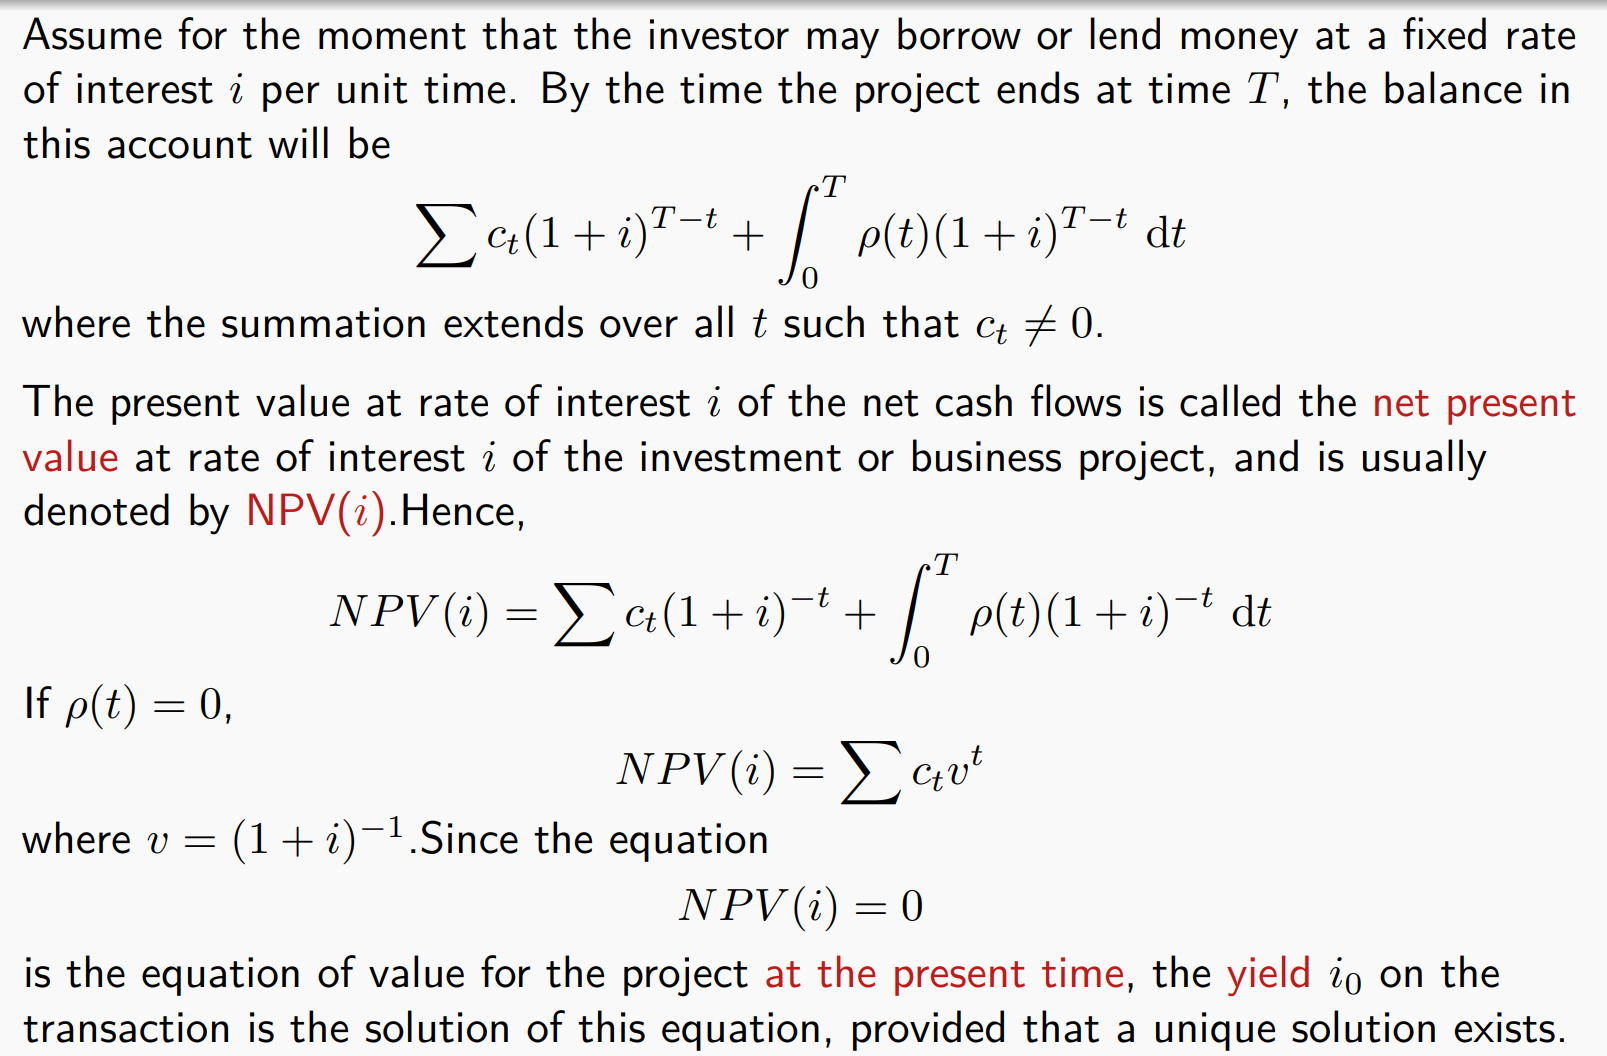
Net present values and yields
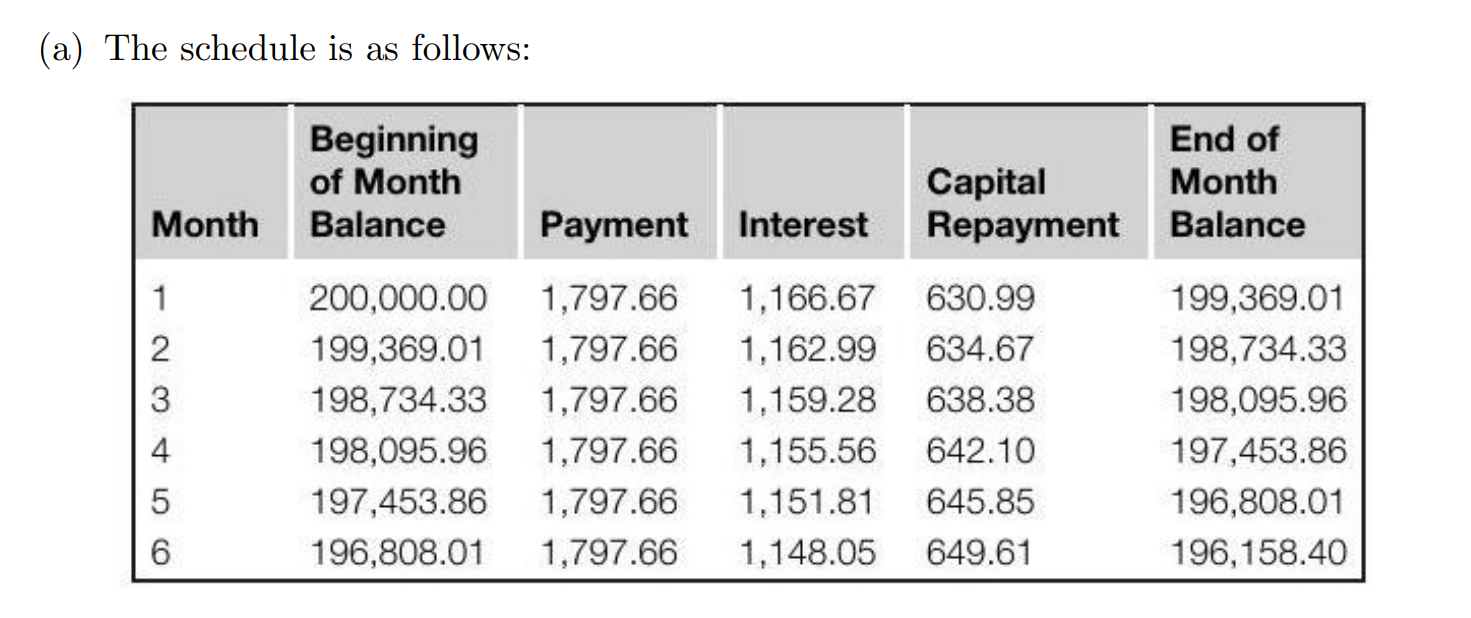
Loan Repayment Schedules
表格模板:
符号定义:
利息是由loan计算出来的
每期固定还钱金额=还款本金+利息
在
prospective method:
Consider the loan transactions at time
Retrospective method:
注意这里:在t时刻是要把
改变利率的loan题目:
注意:reduced final instalment:算出
专业术语
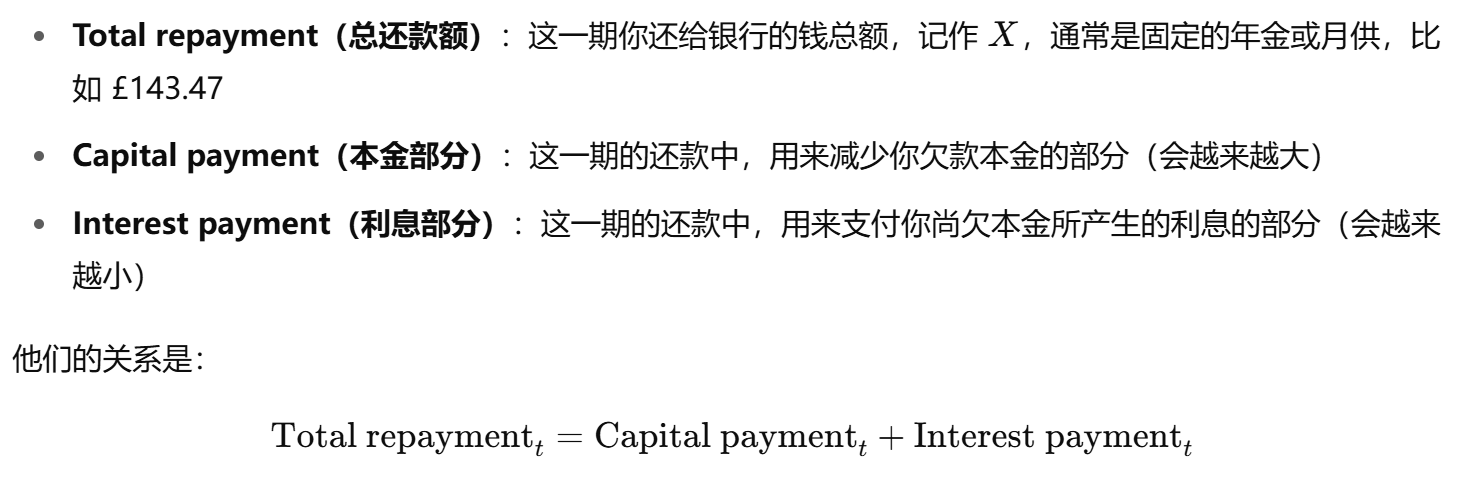
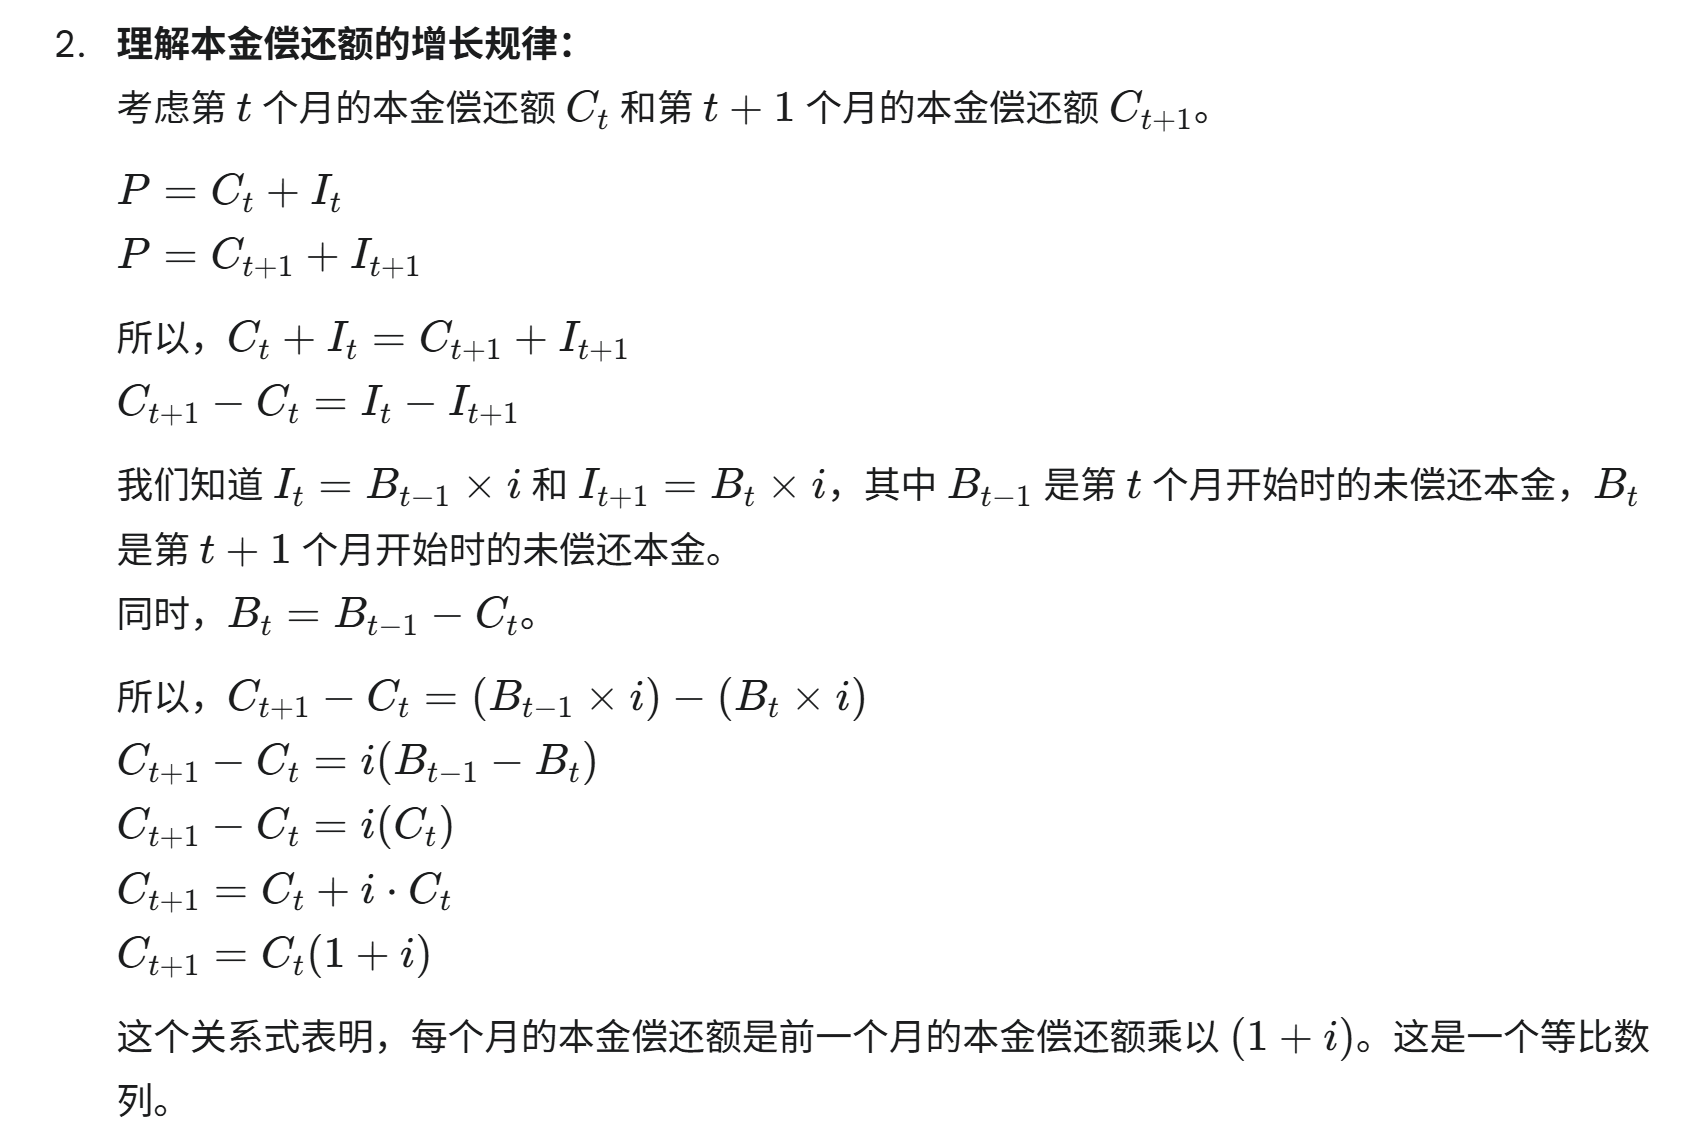
还贷款中本金_t与本金_t-1的变化
Net present values and yields
IRR:指
题型1.比较两个项目的IRR:
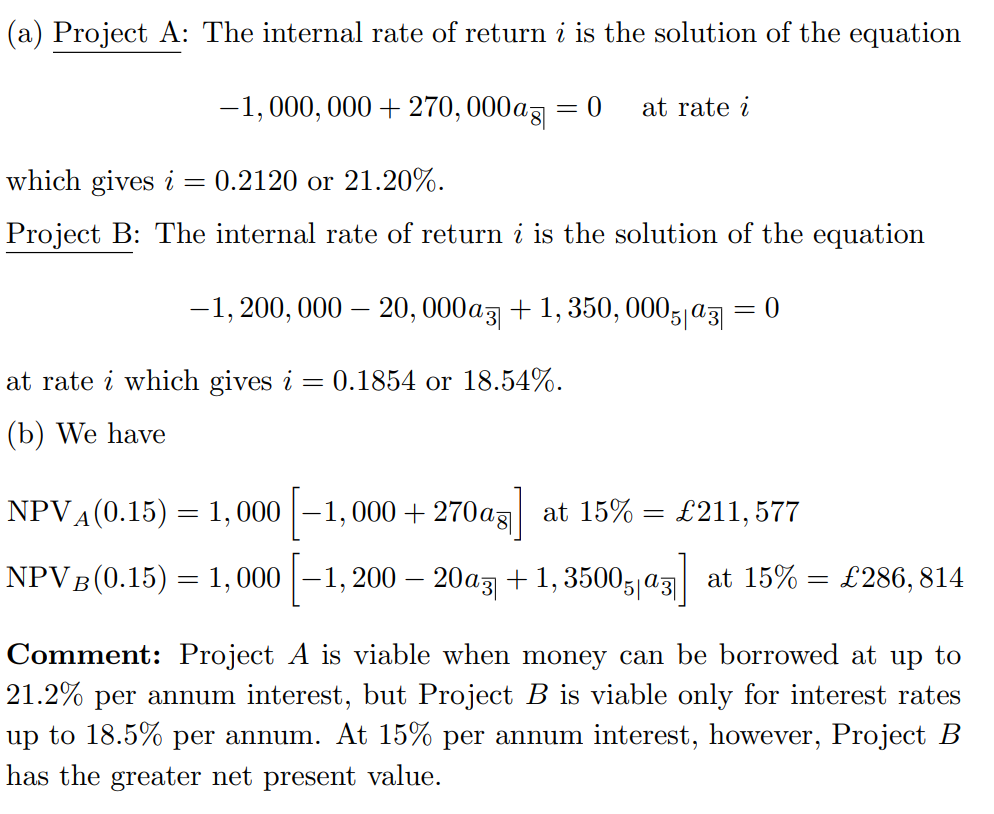
注意:
**IRR 只是一个内部衡量指标,不能脱离市场贴现率 %i_1%独立做出判断。
真正决定获利的是项目在
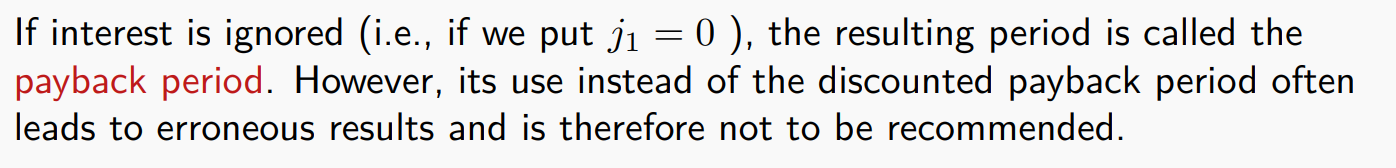
题型2.贴现回收期 (DPP)
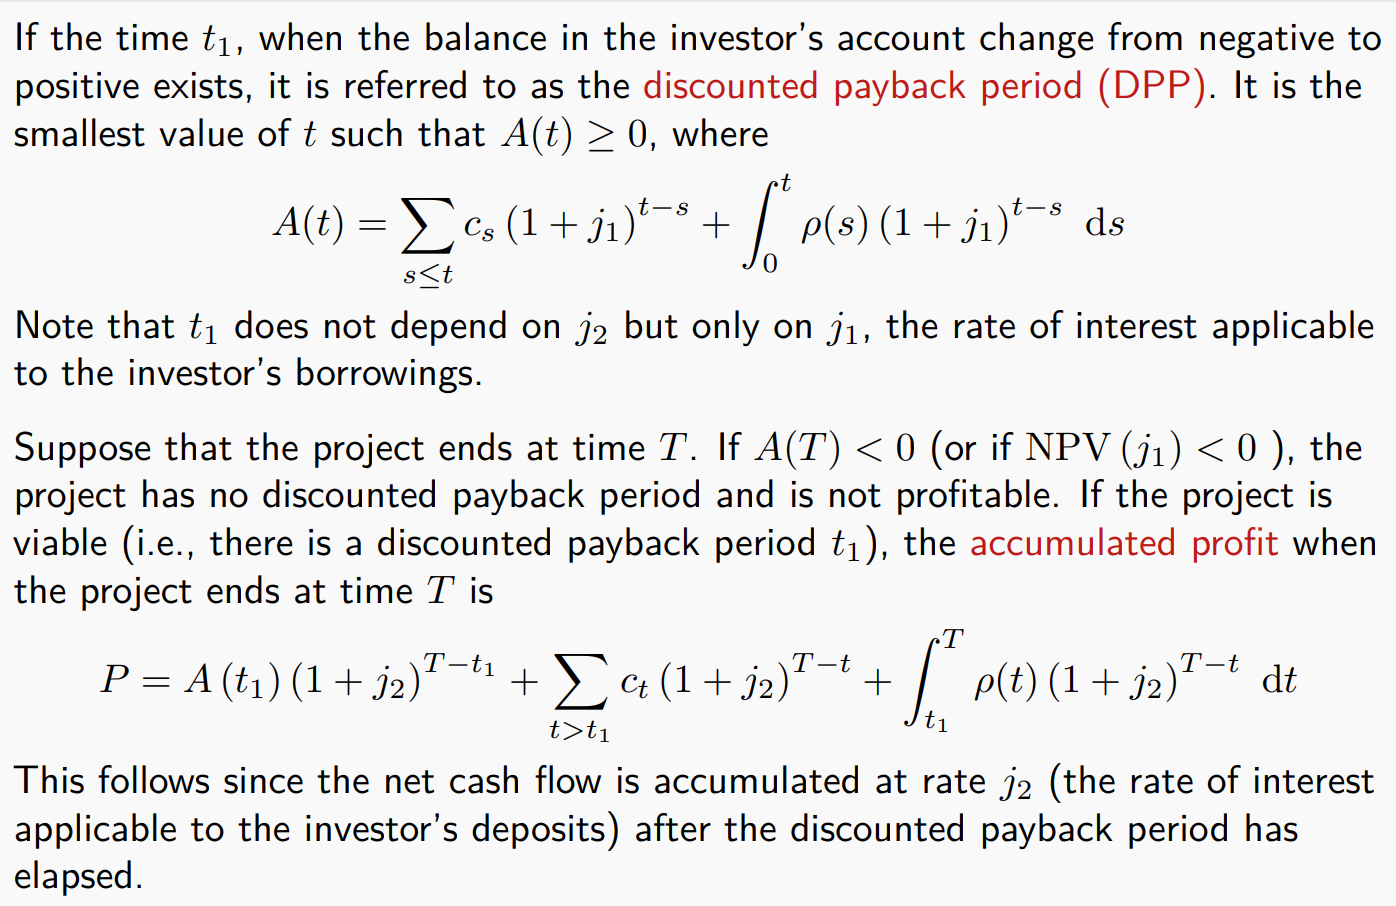
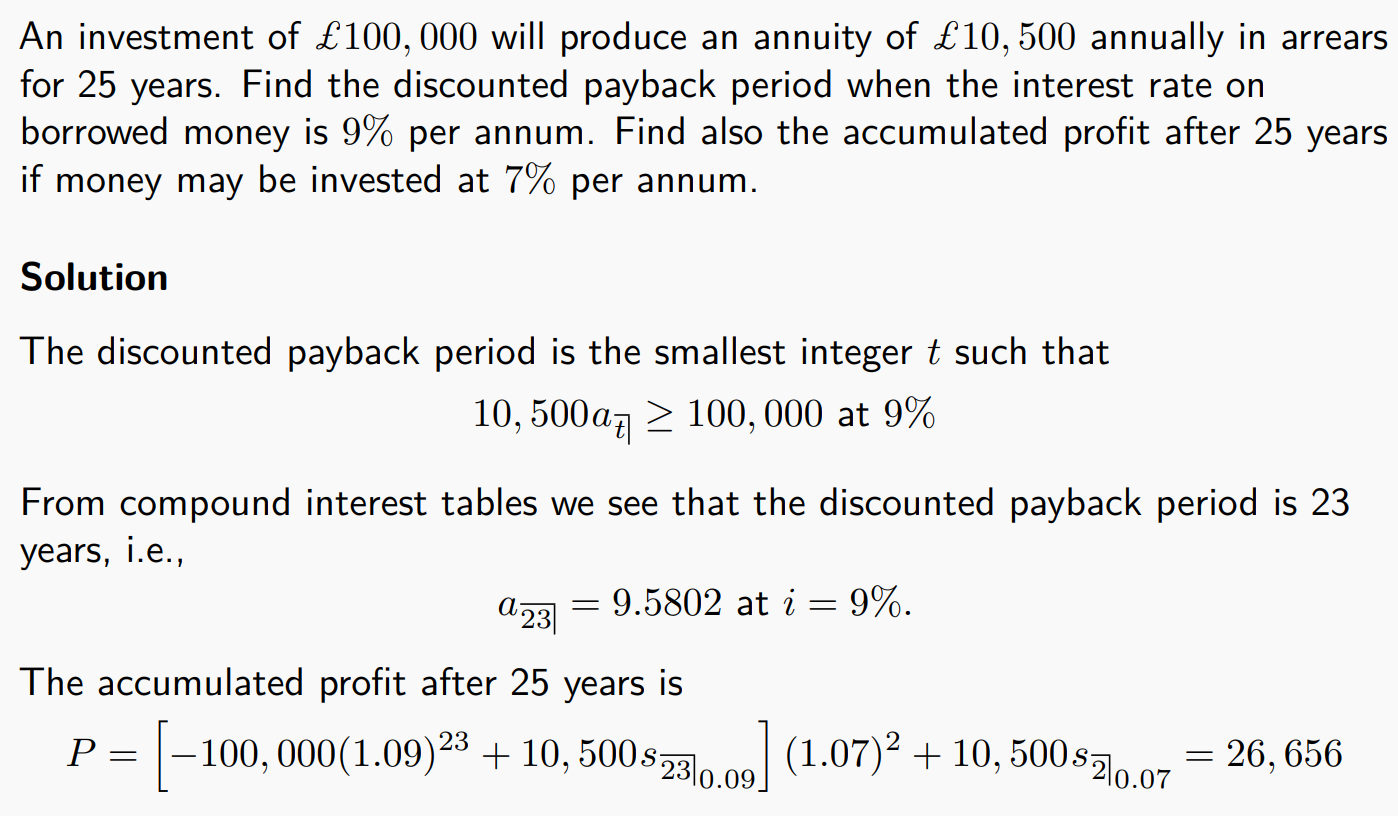
注意:一旦还款结束,折现率了就不再是借钱的那个利率了。
Securities
Fixed interest security
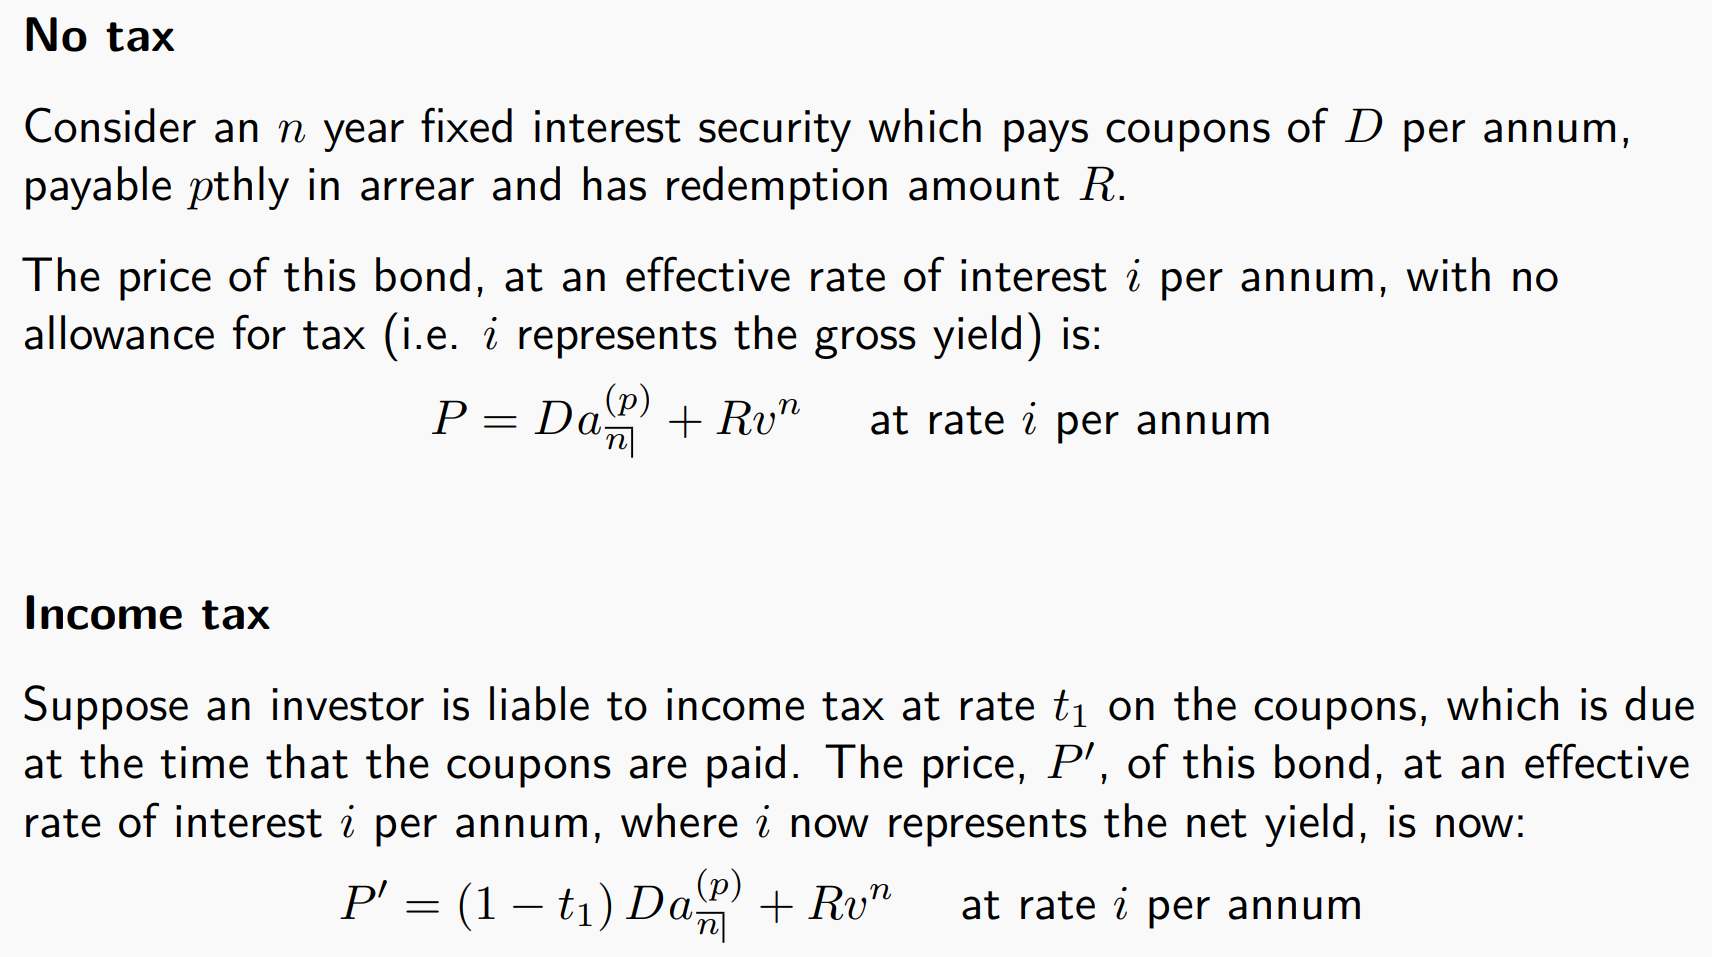
Pricing with Tax
注意点:
- i 指的是折现的时候的i
- p指的是利息分p次给的p
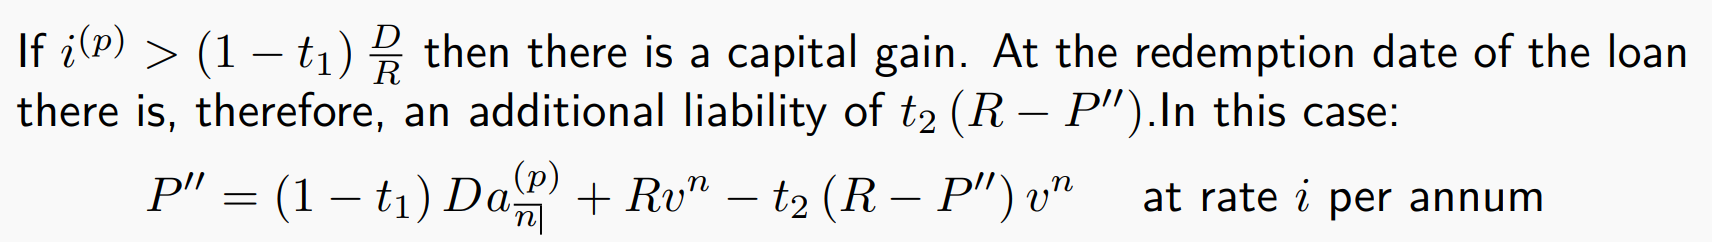
Optional redemption dates
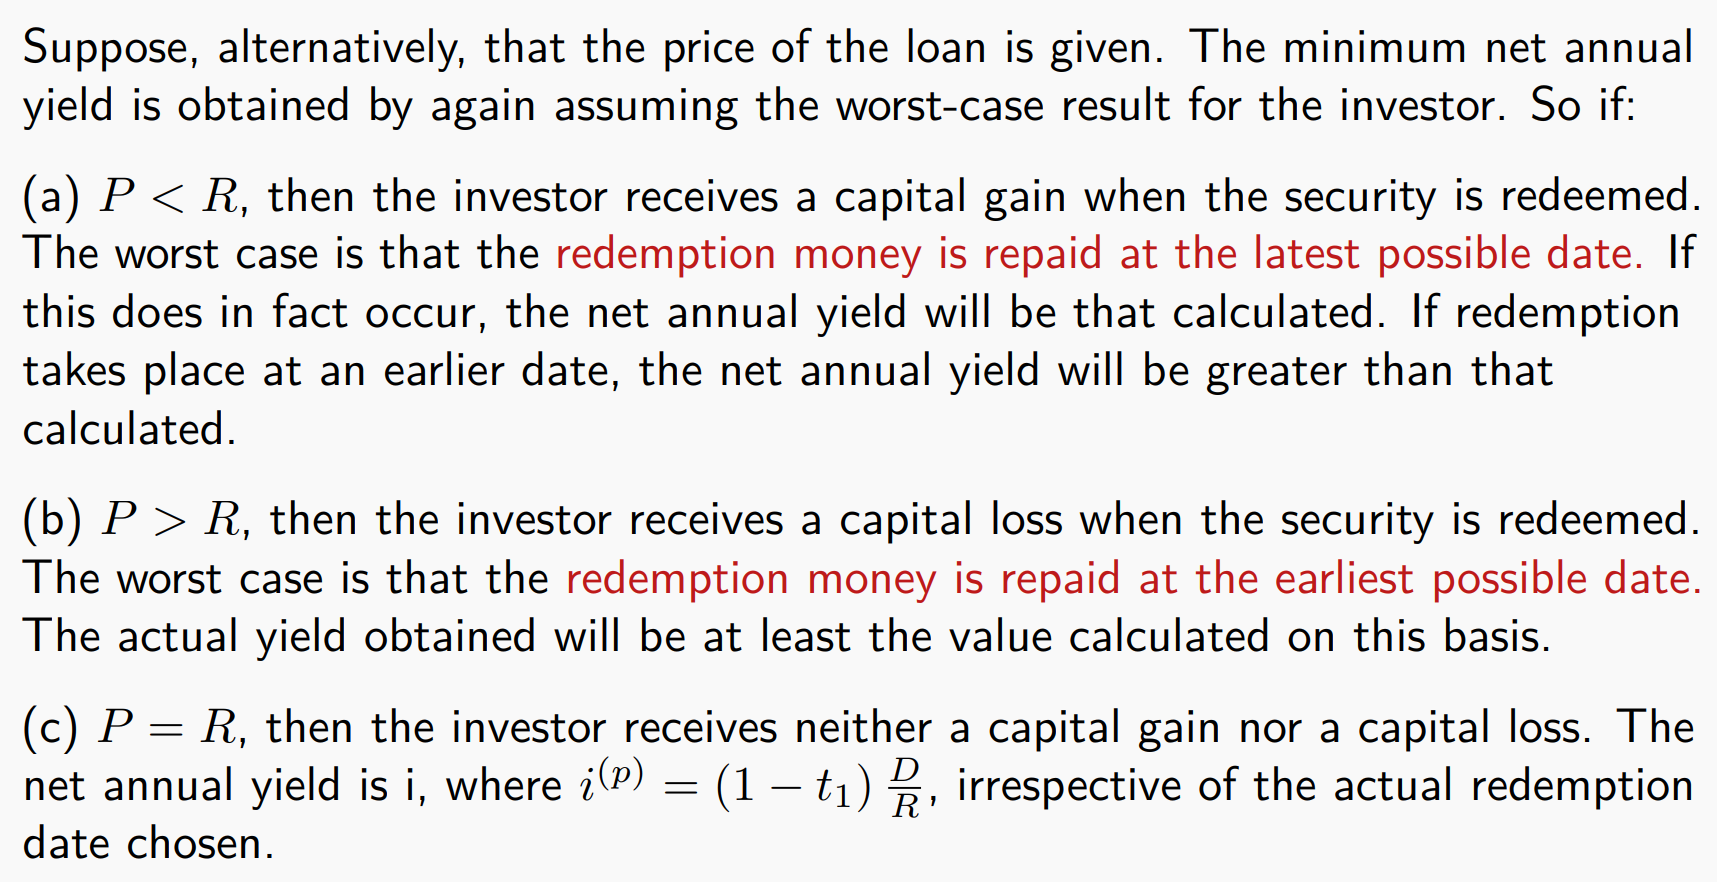
题型1.已知给定了发行价
题型2.投资者希望到达至少
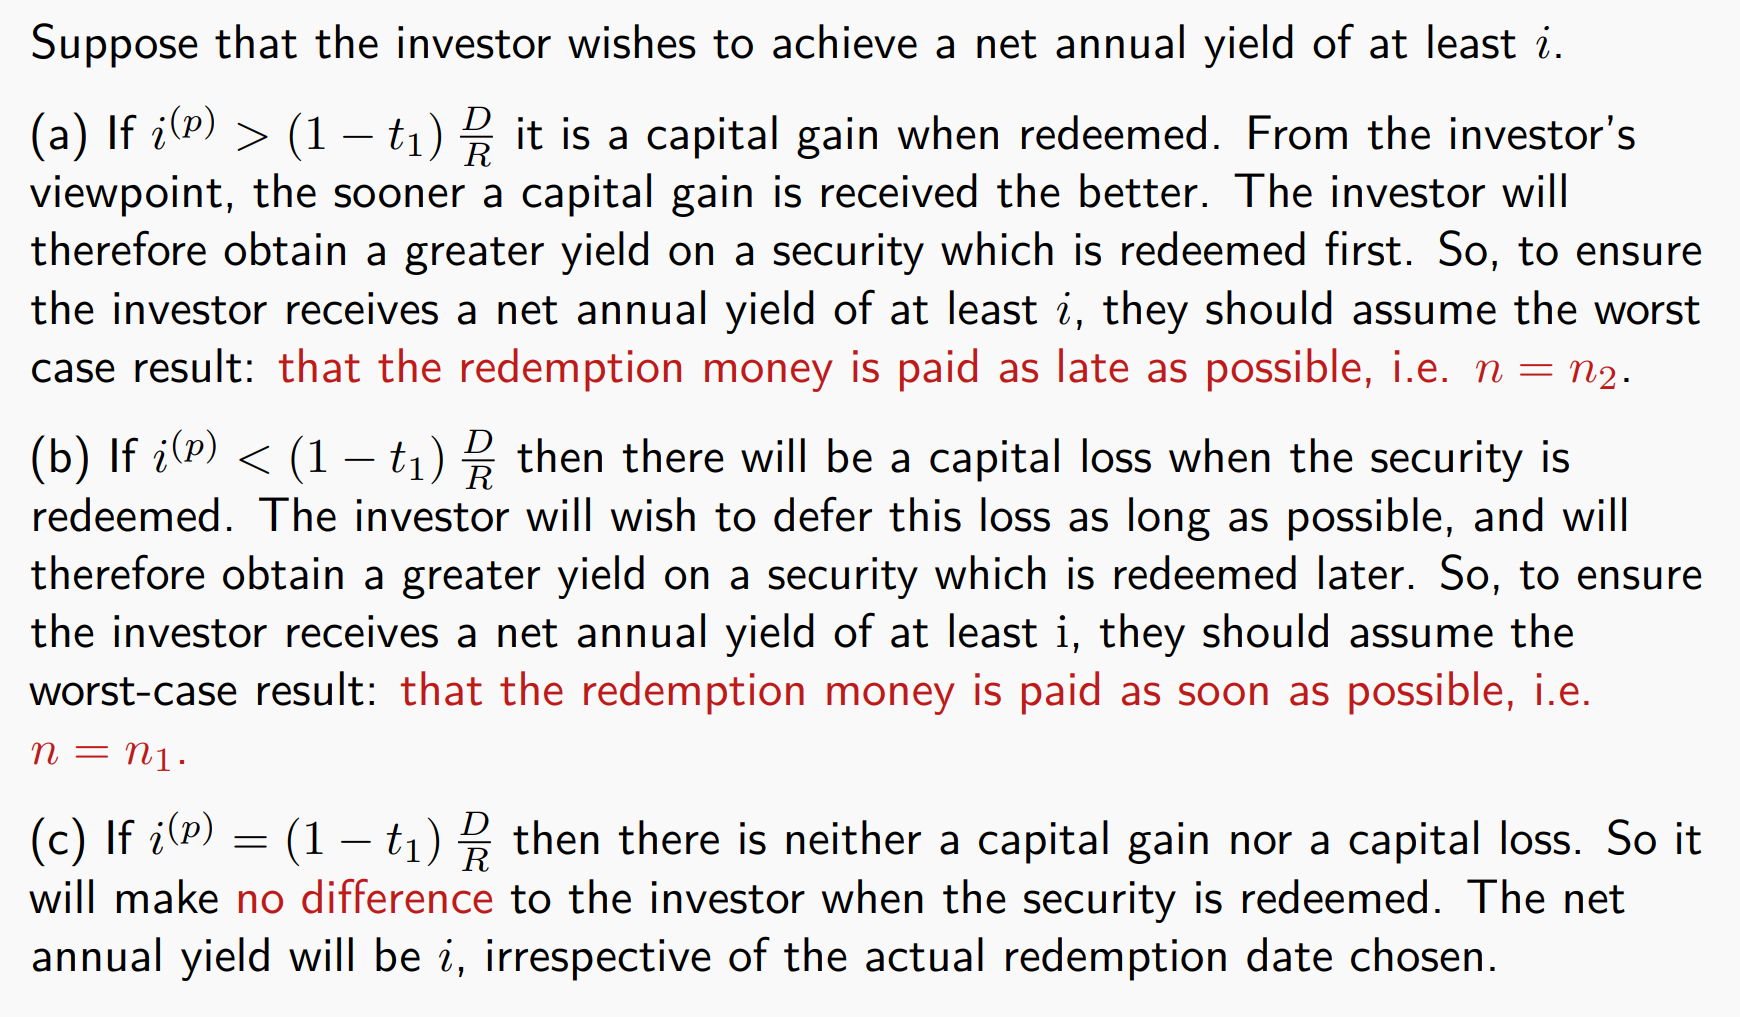
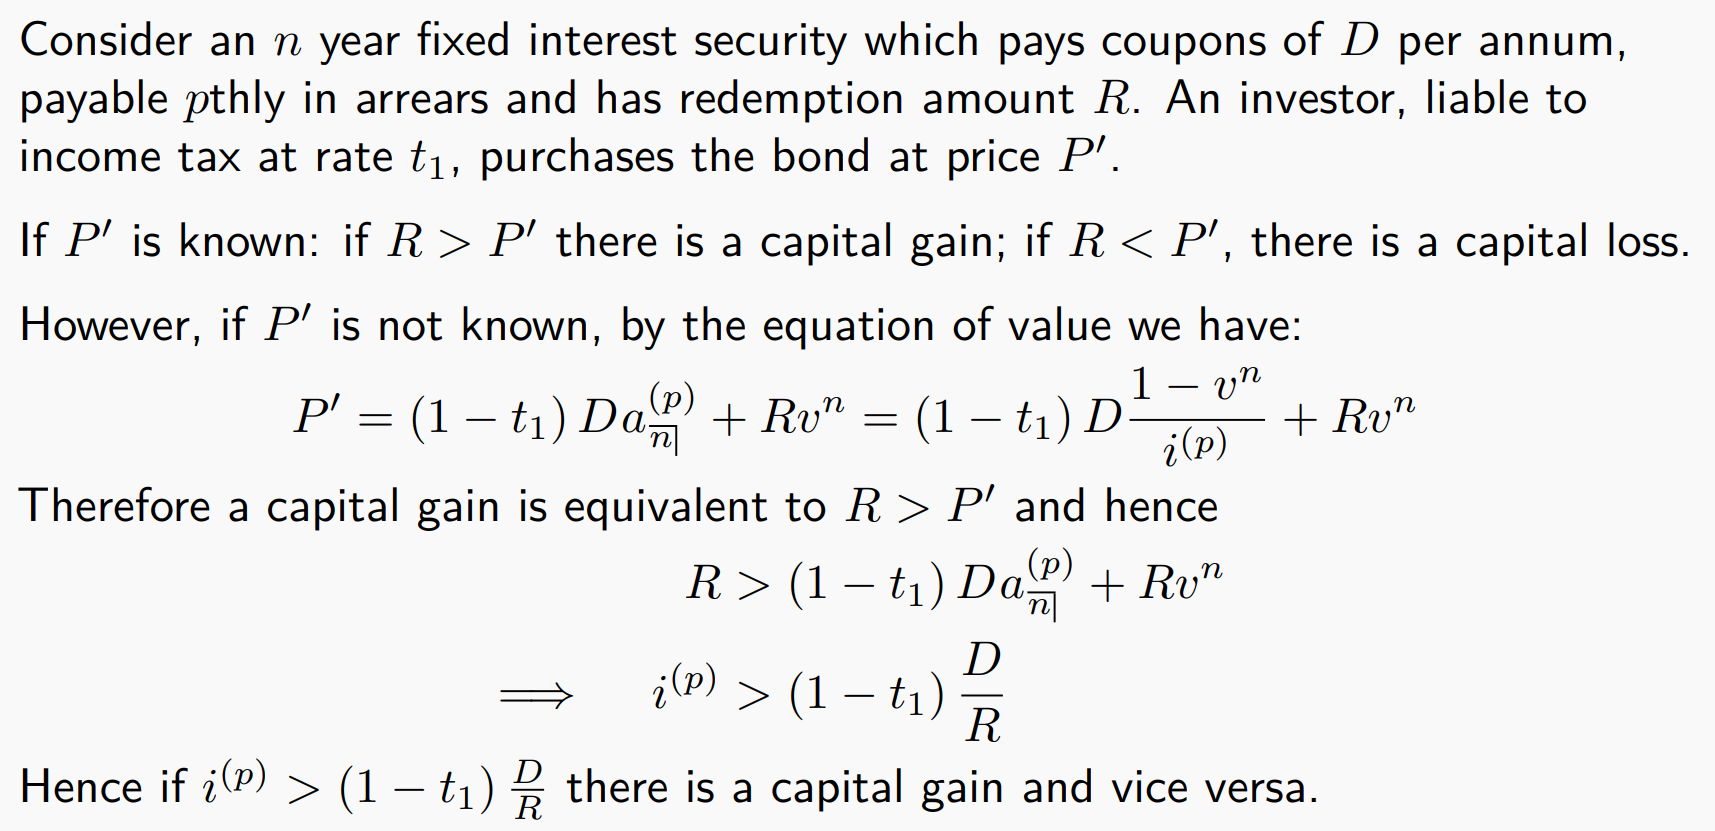
总结:
capital gain :极端情况是:越晚赎回。
capital loss :极端情况是:越早赎回。
记忆方法可以用零息债卷来记忆:
折价买入(capital gain)越晚赎回越亏
溢价买入(capital loss)越早赎回越亏
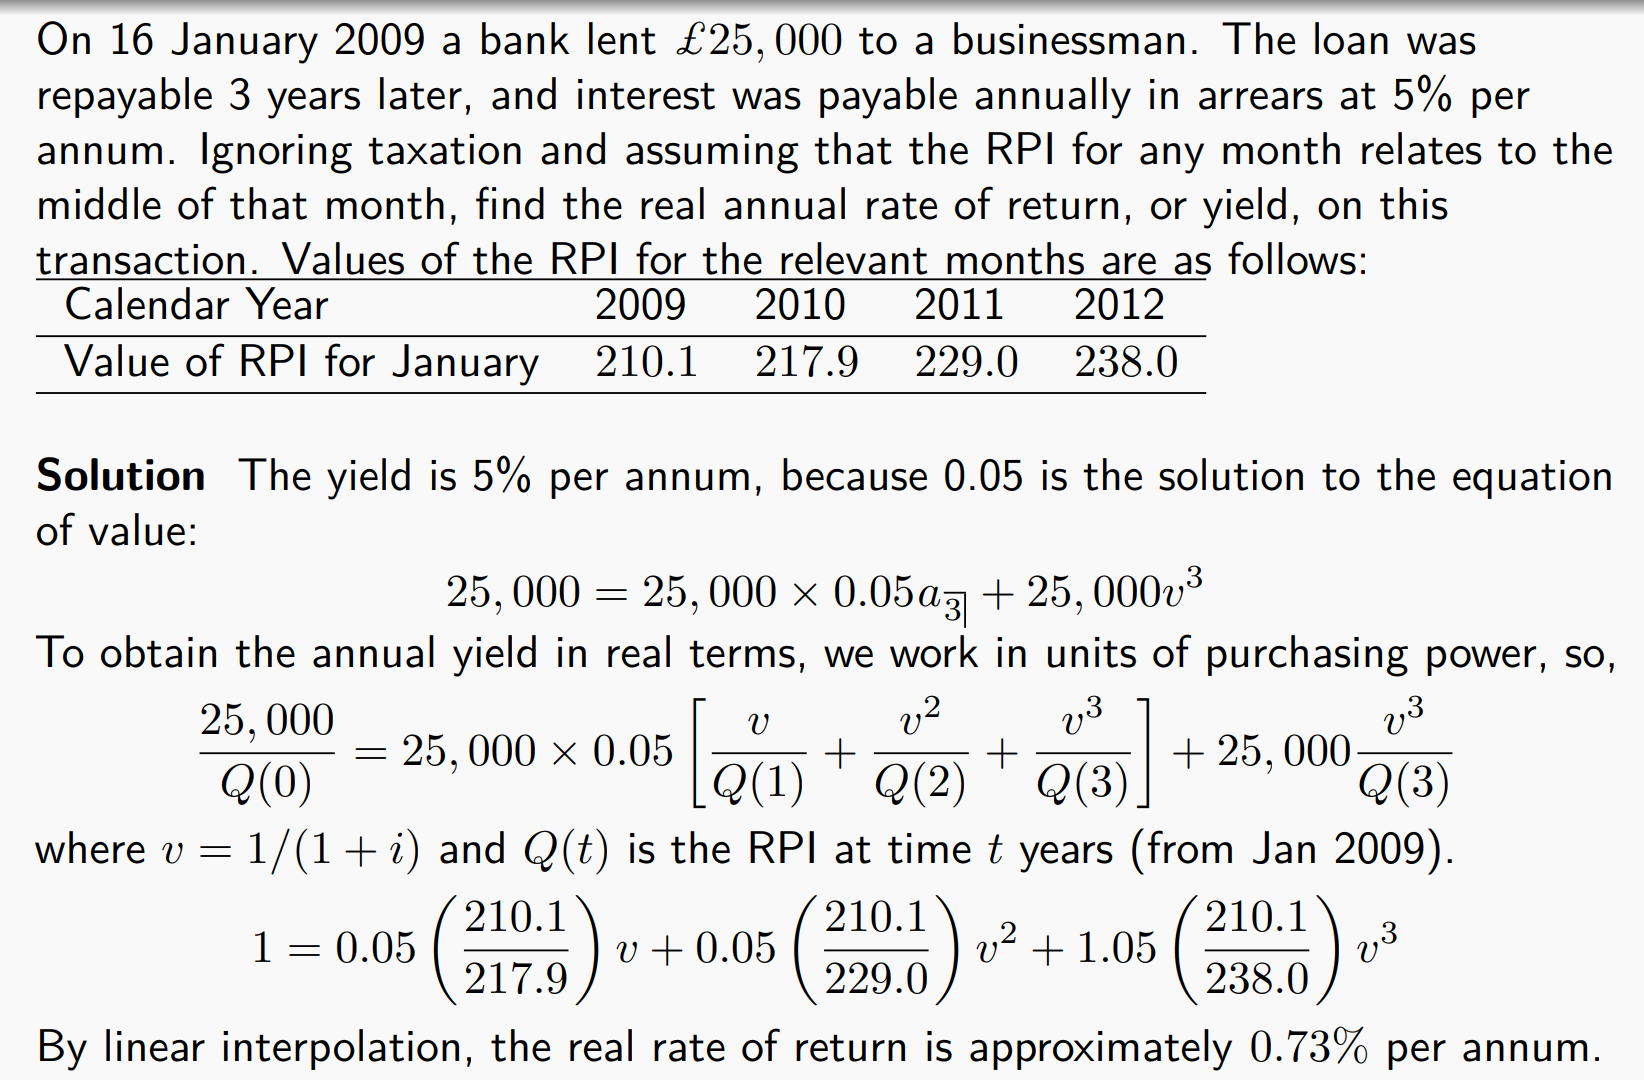
Real returns and index-linked bonds(Consider Inflation)
Spot rate
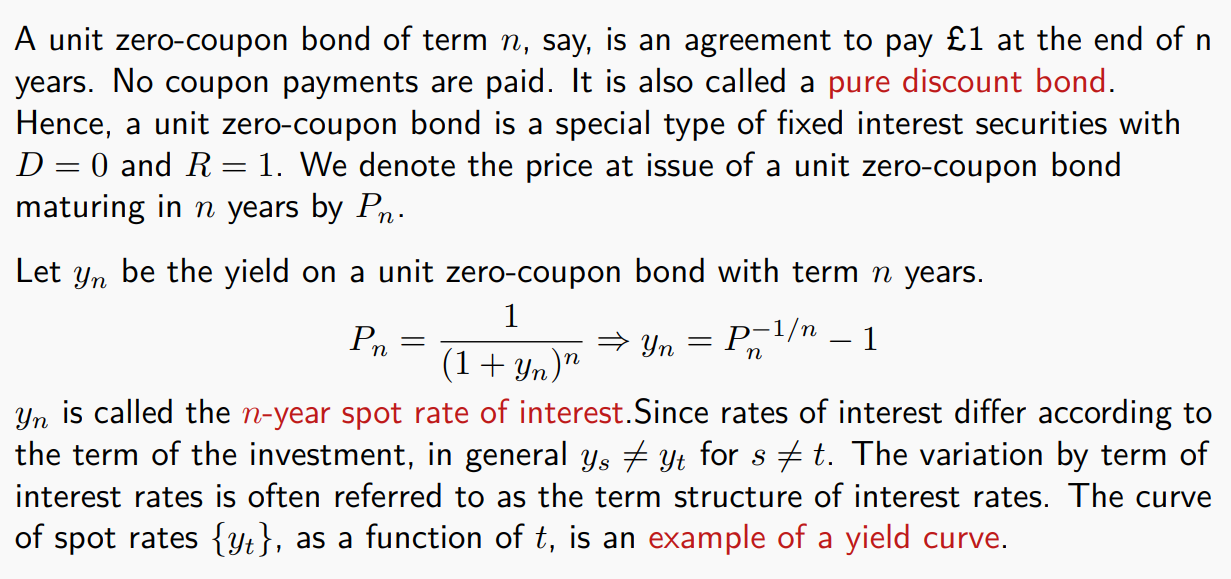
注意:
这里的
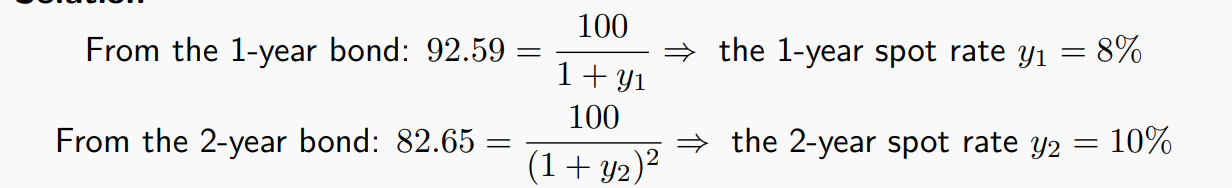
求解spot rate
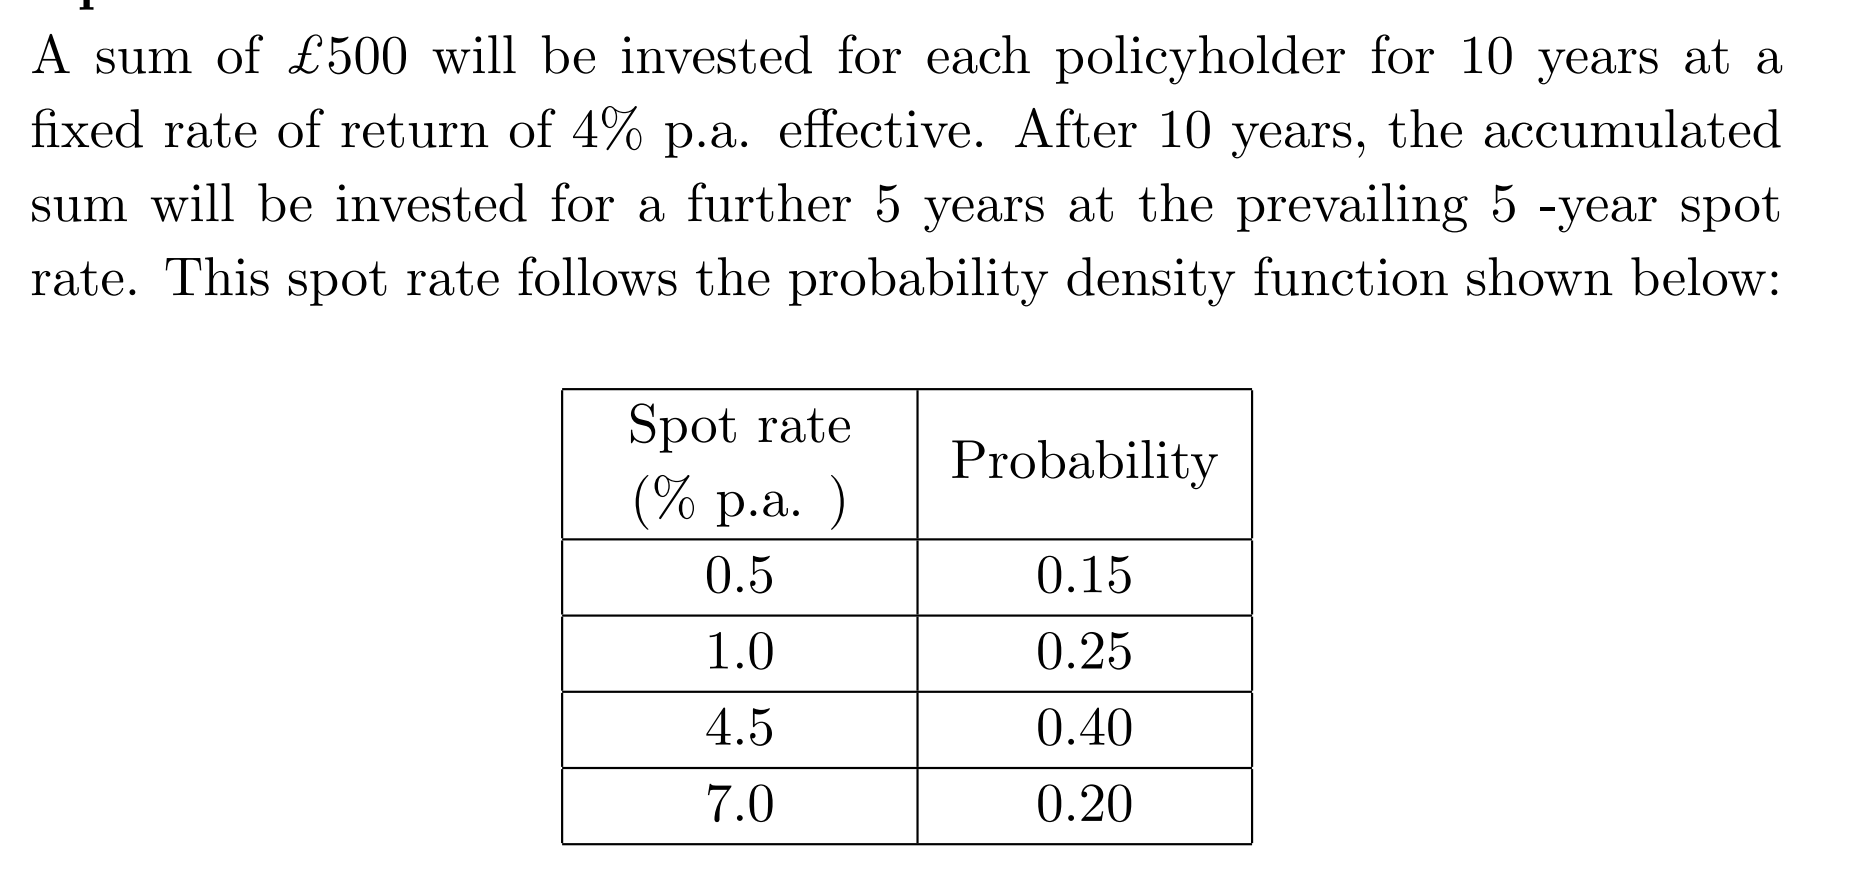
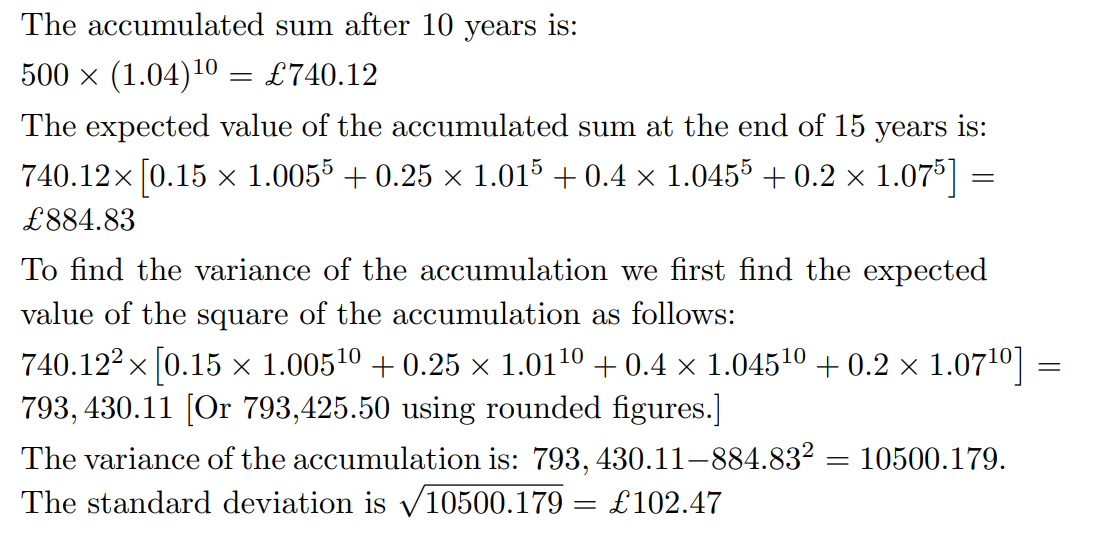
spot rate 的期望求解:
Gross Redemption Yield
Gross Redemption Yield(GRY)(总到期收益率),是指投资者从购买一只债券到其到期为止,按照购买价格获得的年化总回报率,包括:
所有未来的票息收入(coupons),以及
到期时本金的偿还(redemption amount),
而不考虑税收或费用影响,因此叫做“gross”
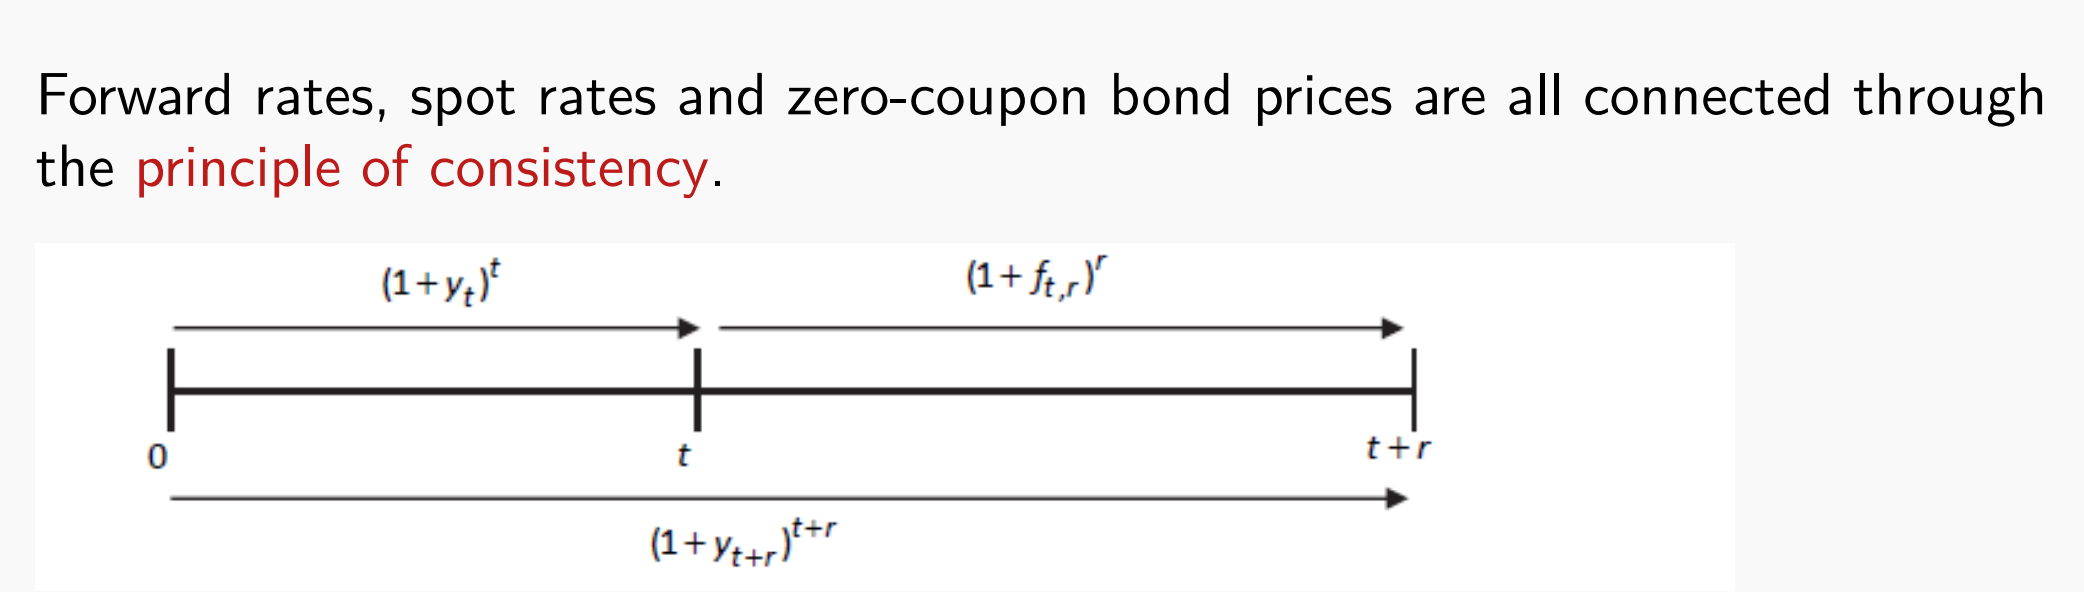
forward rates
n-year par yield
就是发行价和赎回价都是1的时候,利息该给多少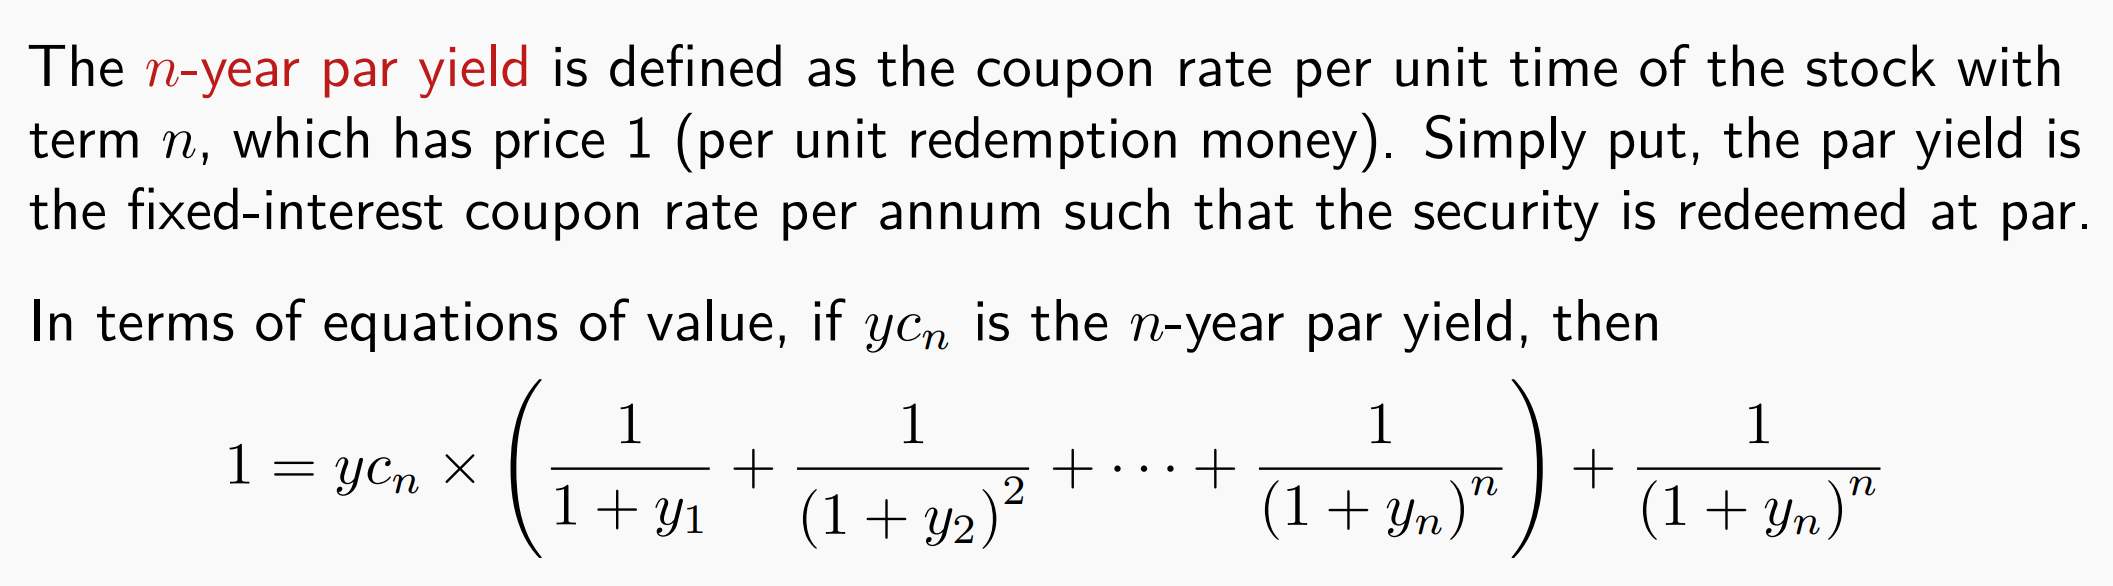
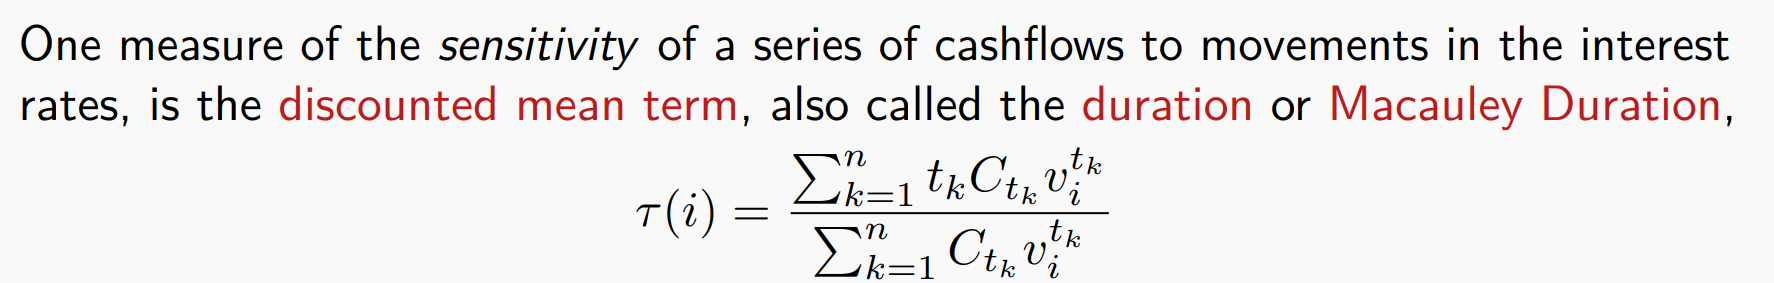
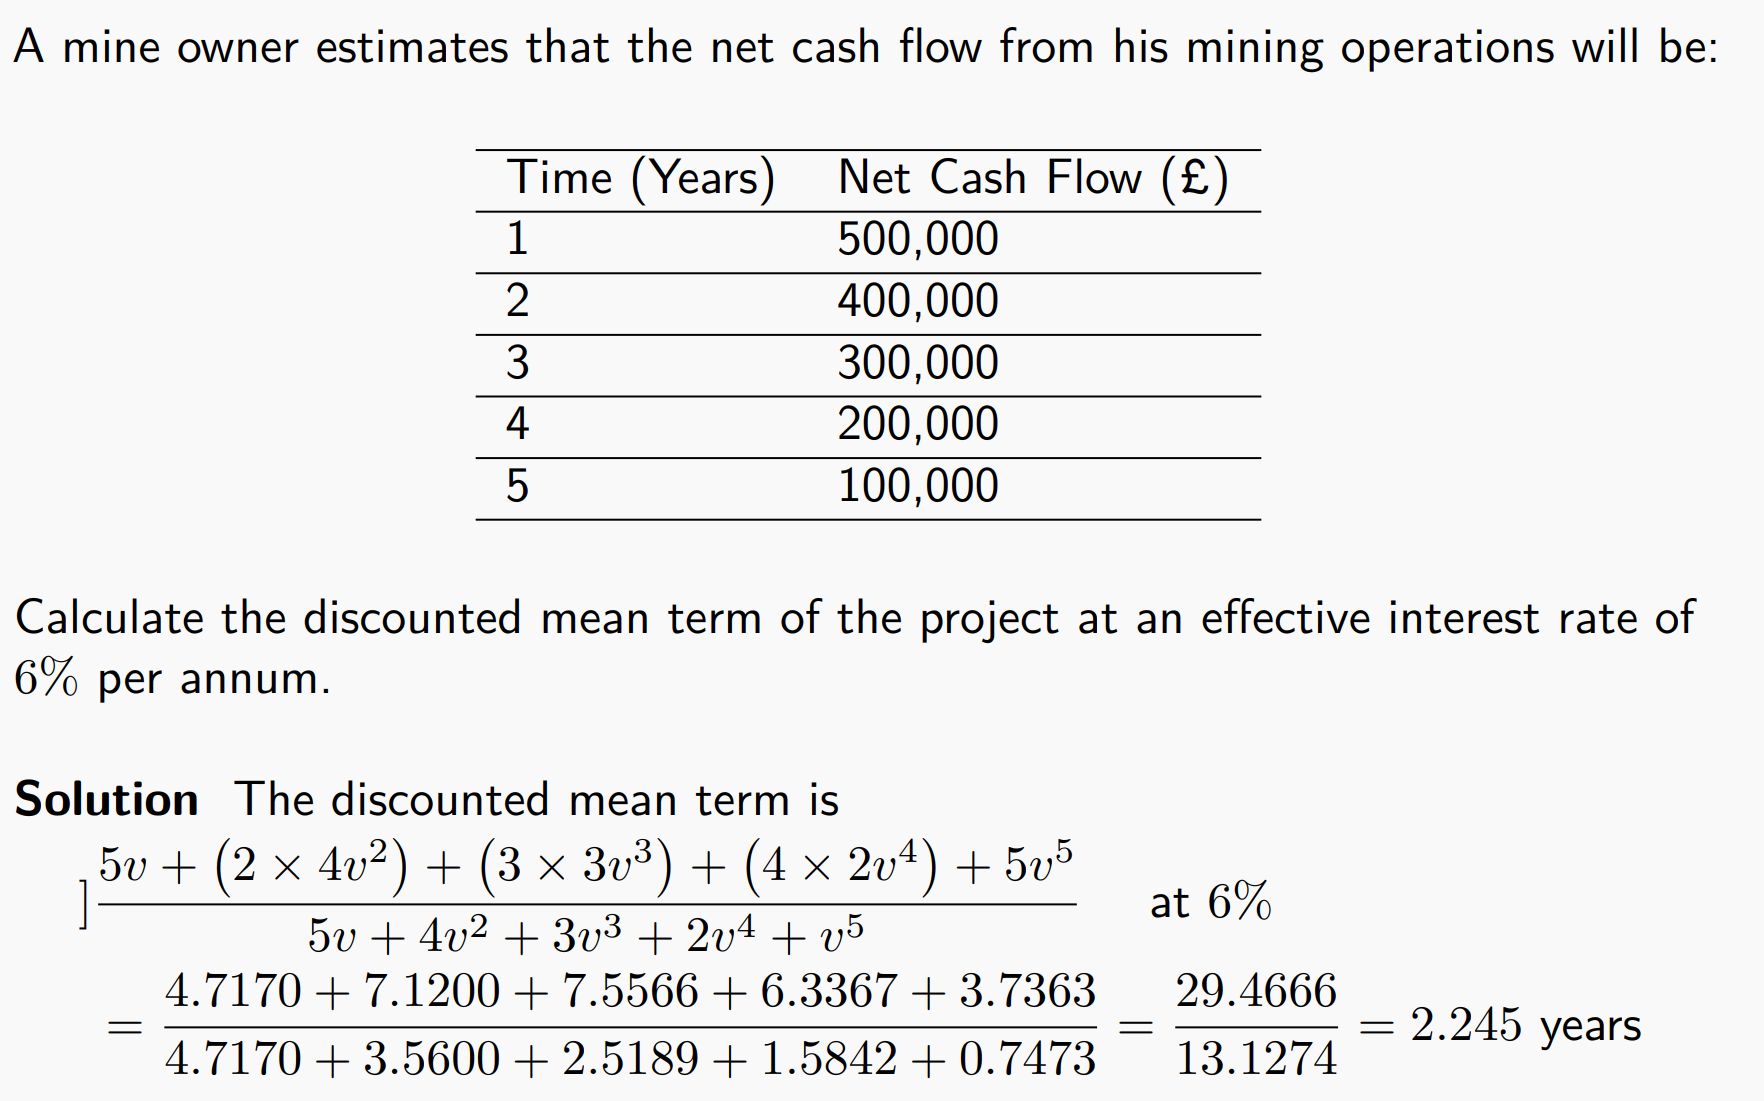
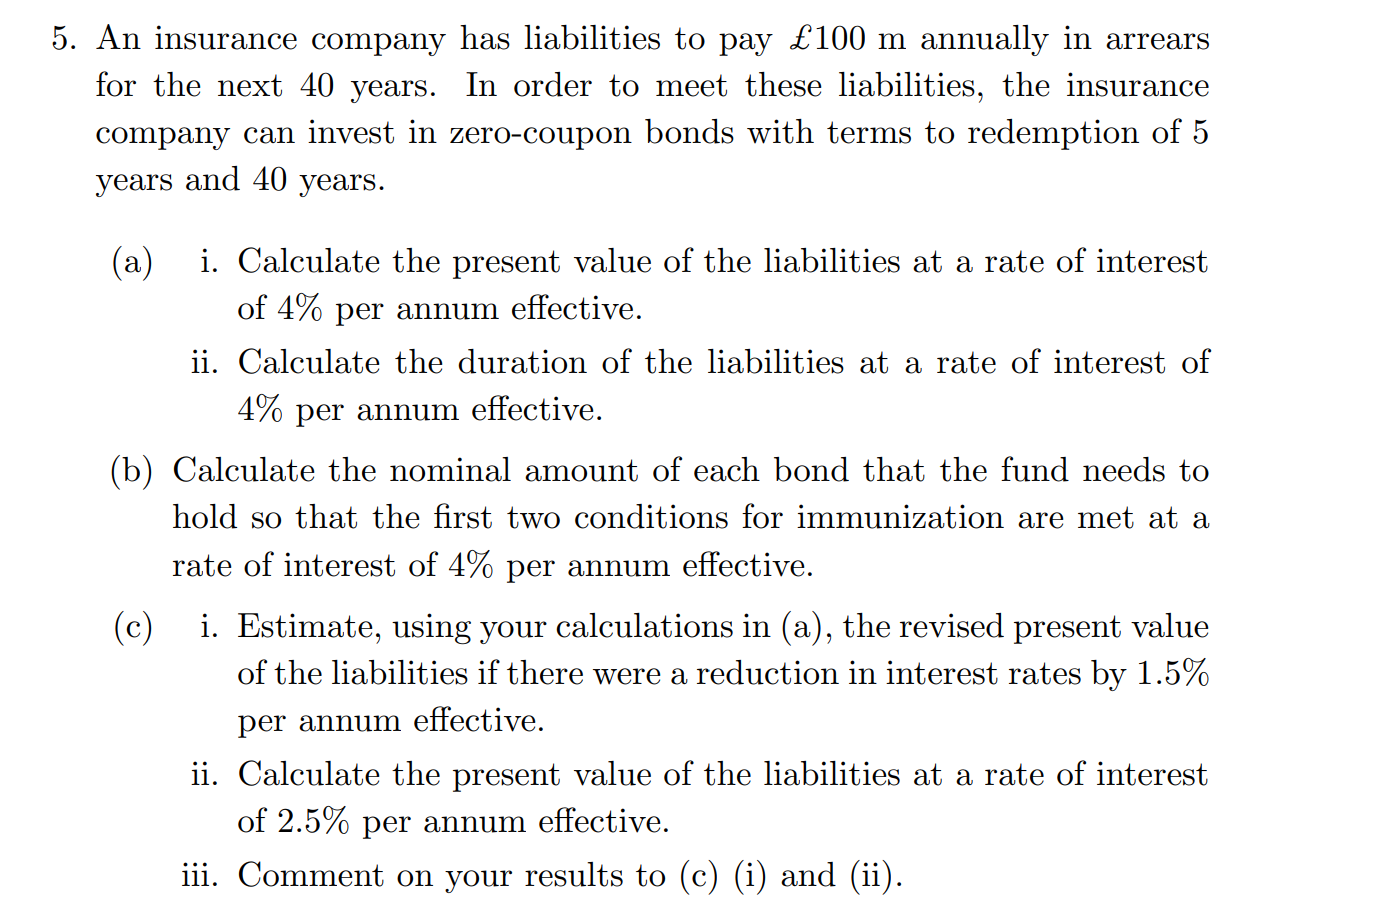
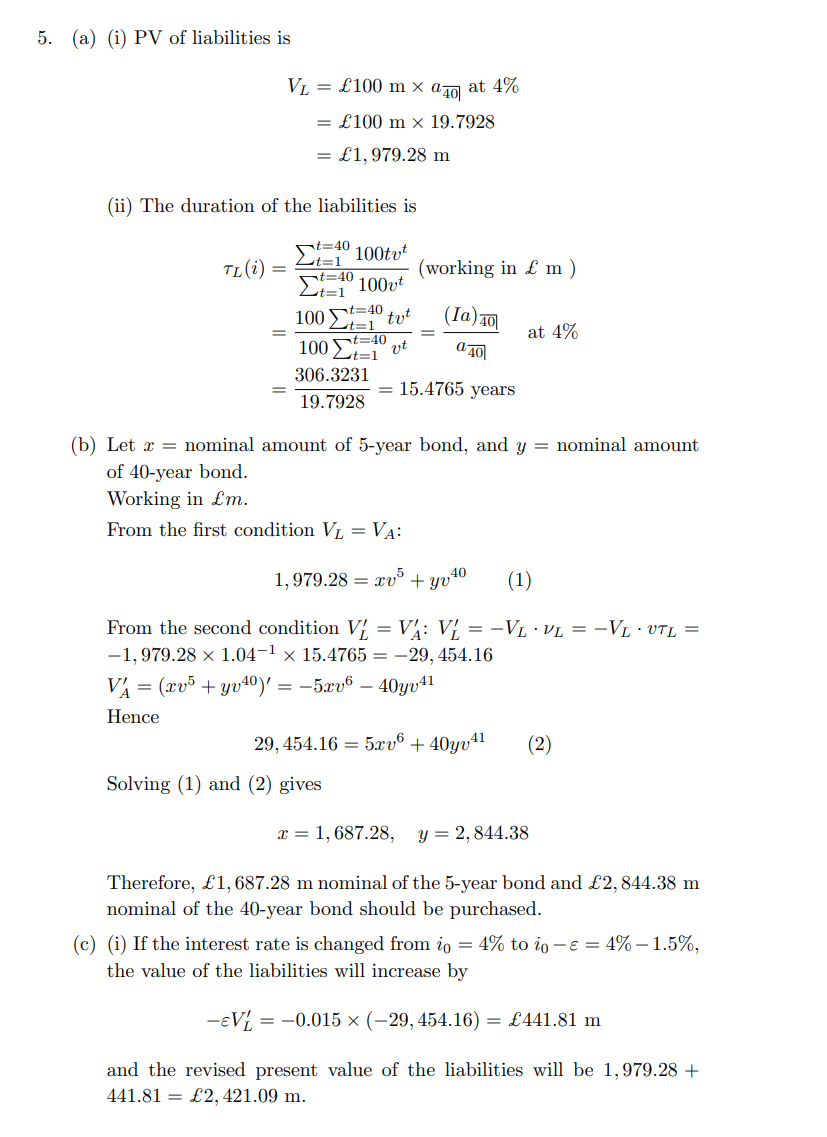
Duration
Duration 是指债券现金流(利息和本金)按现值权重计算的加权平均到期时间。它回答的是:“投资人平均要等多久,才能回收投入的每一块钱的现值?”
Effective duration (or volatility),
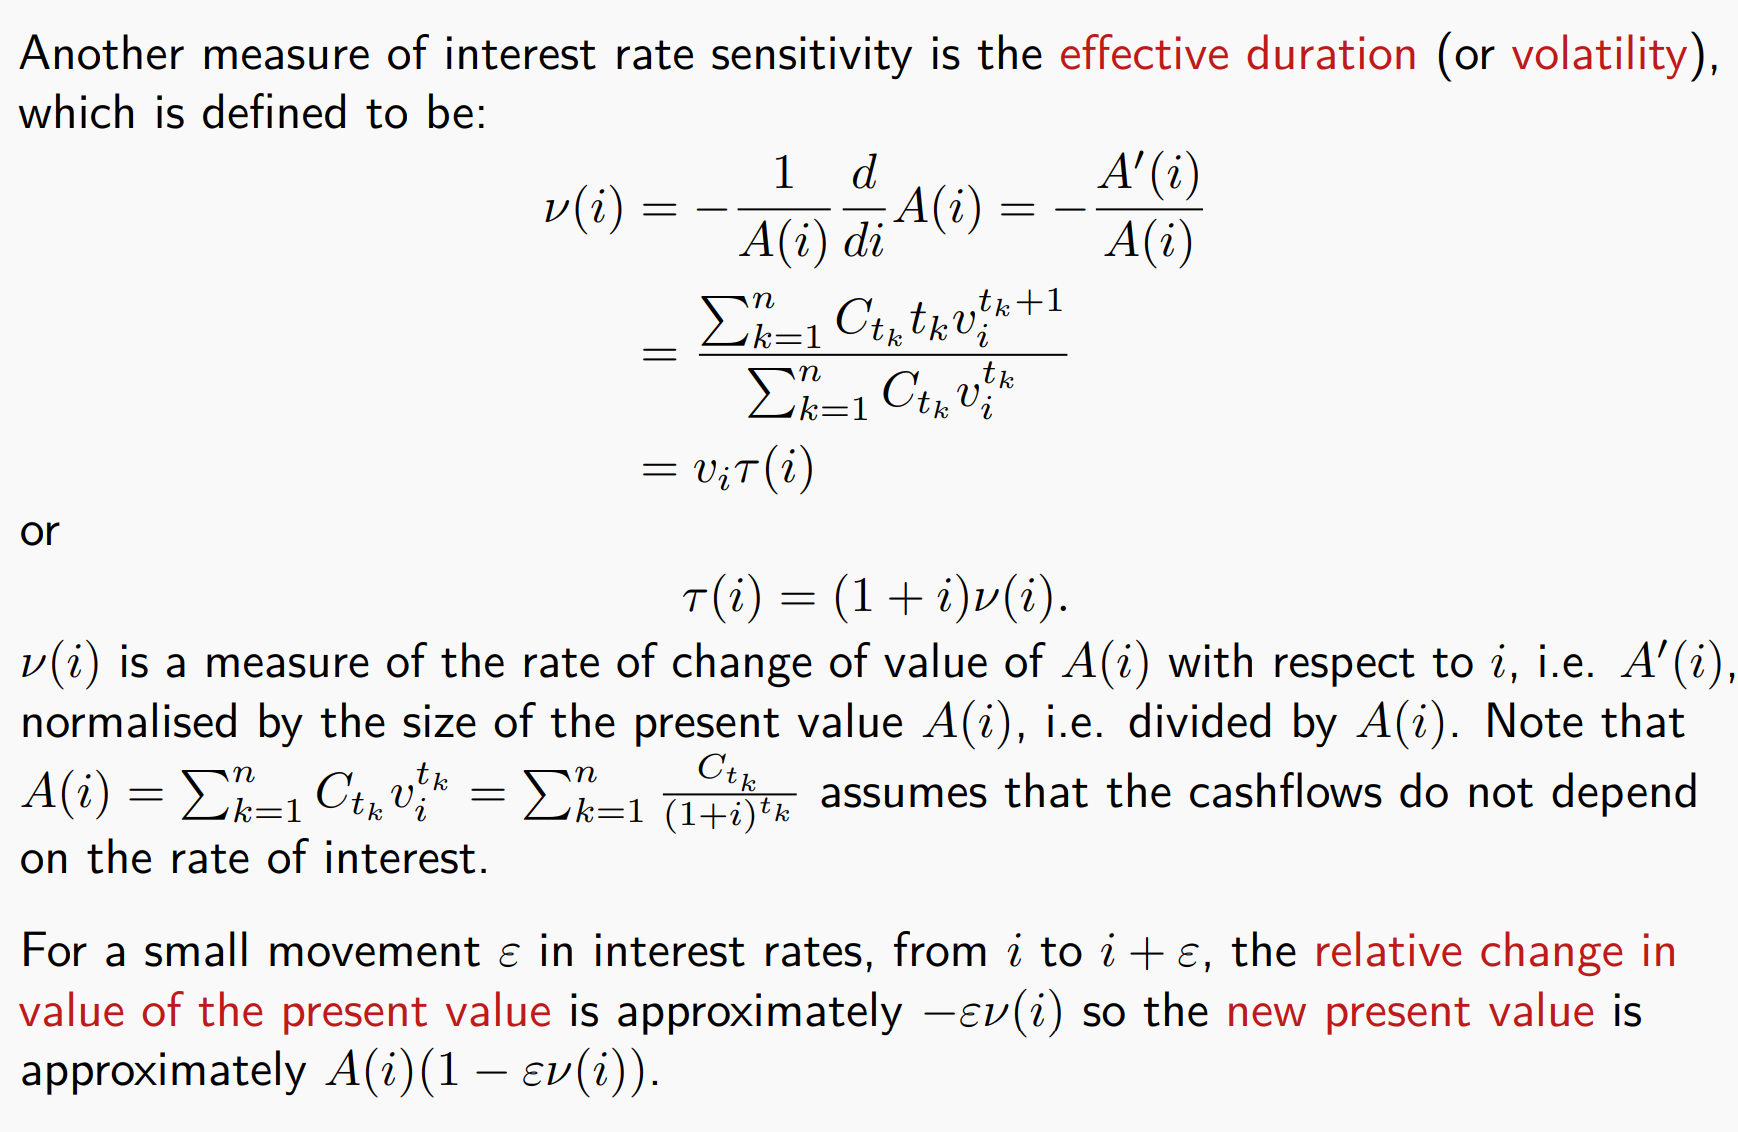
注意:
if the interest rate decreases from
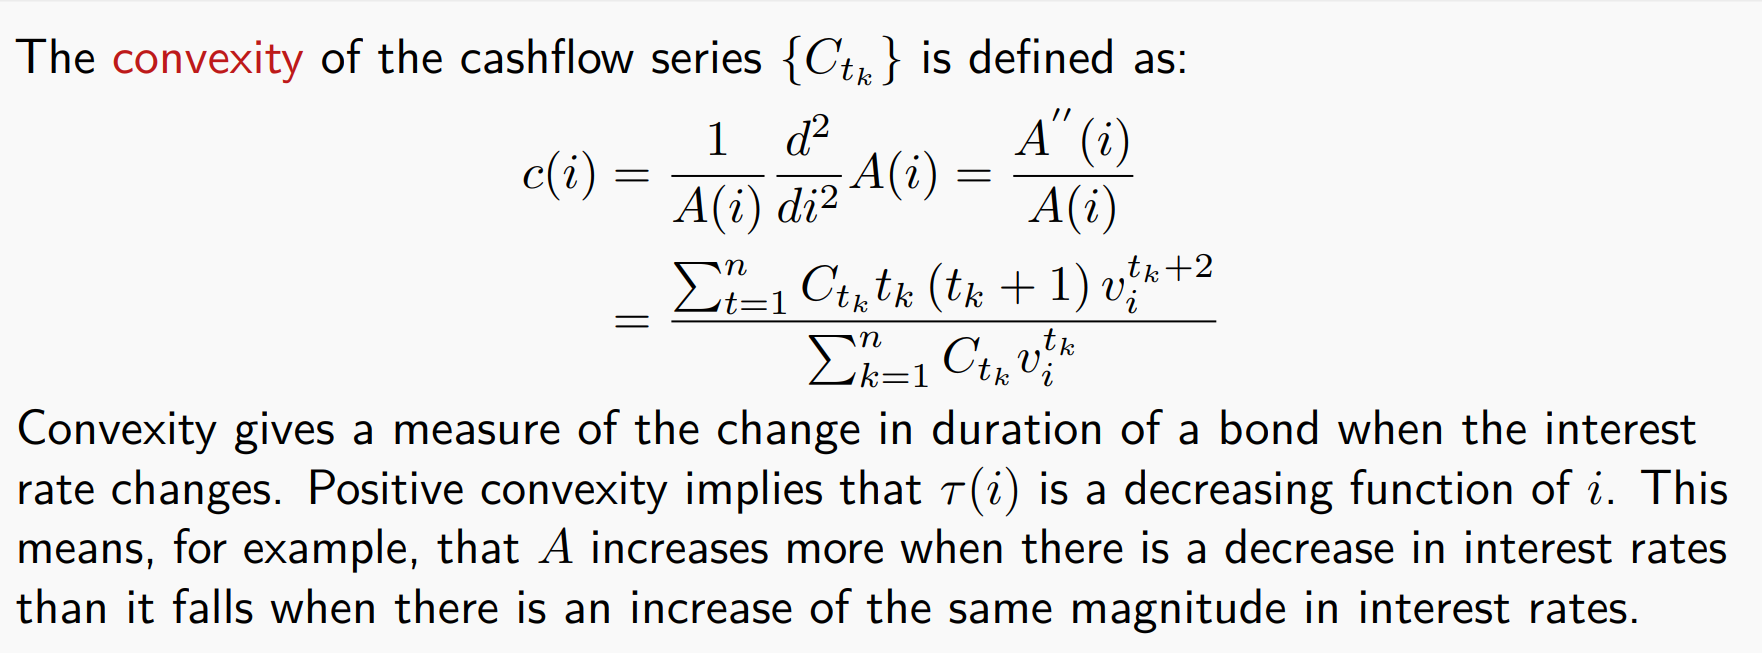
Covexity
Redington’s condition for Immunisation
这就是所谓的“对利率风险免疫”
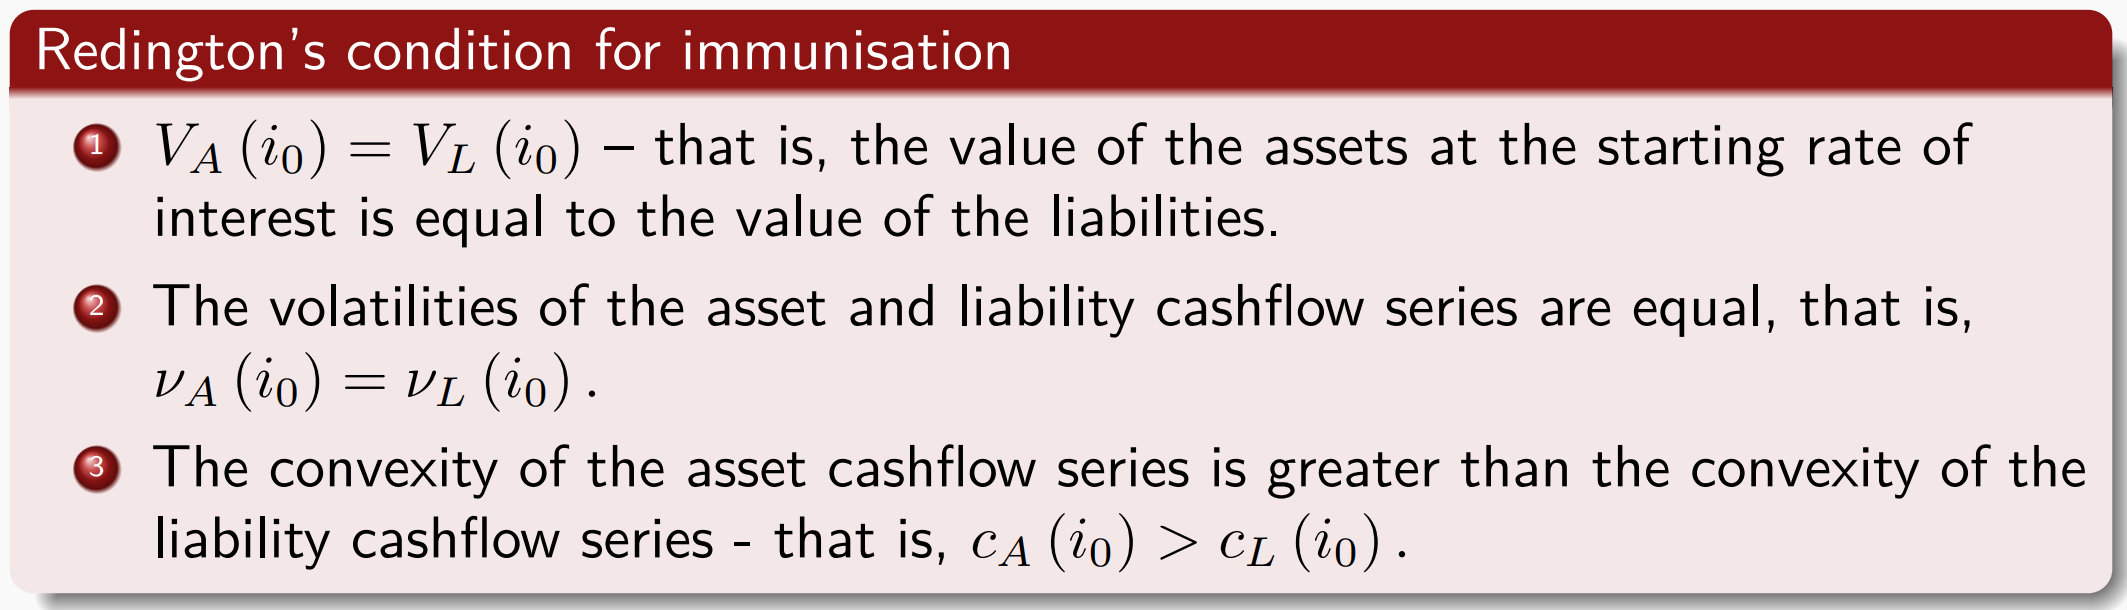
注意:第二个condition,只需要直接对
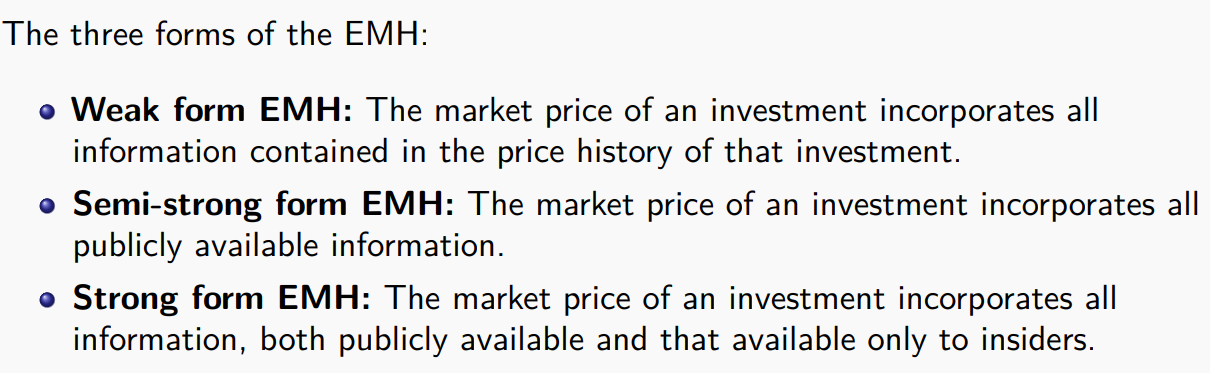
Efficient Markets Hypothesis
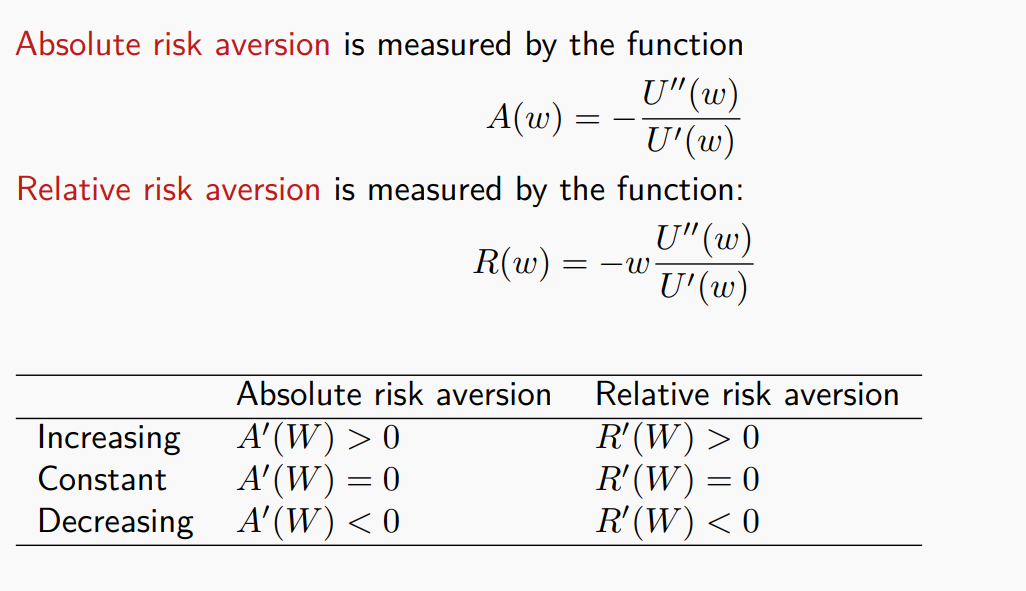
The Expected Utility Theorem
风险类型:
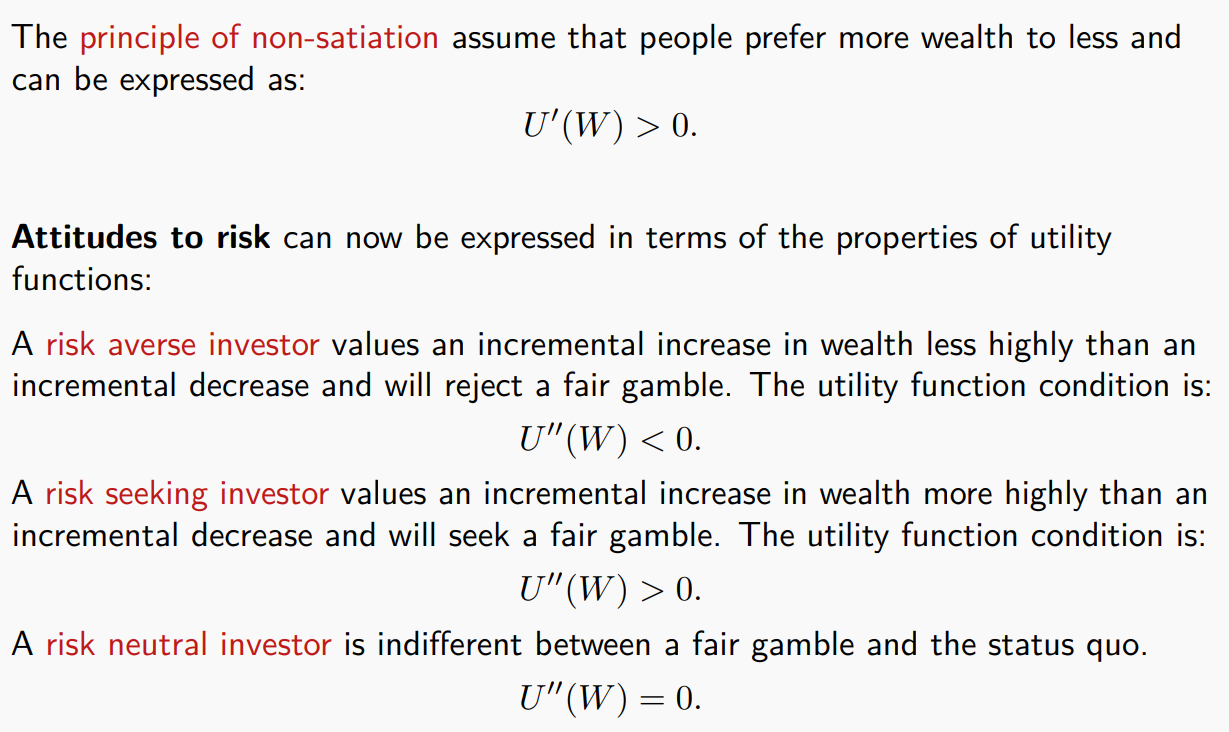
厌恶风险:
Explain what can be deduced about an investor’s utility function if the investor makes decisions based on:
- i. the variance of returns.
- ii. the shortfall probability of returns
ans:
- i. This may imply that the investor has a quadratic utility function.
- ii. This corresponds to a utility function which has a discontinuity at the minimum required retur
Premium and insurance premium
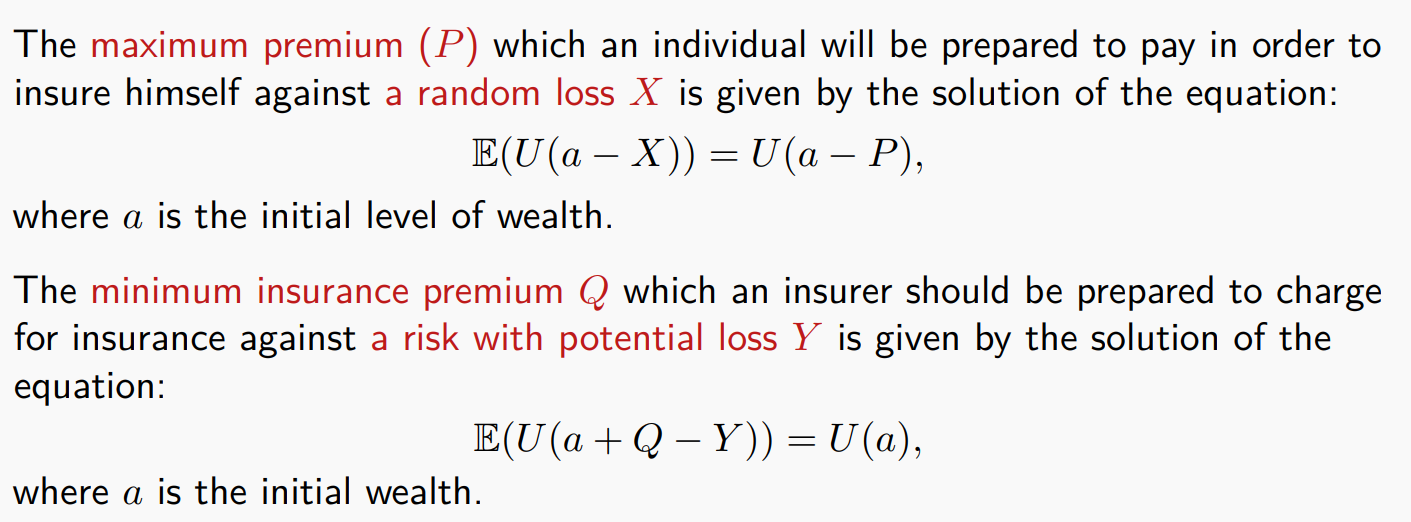
注意先式子之前:
应该先把财富的表达式w写好,再放入
从个体/被保险人角度:
左边是“不买保险,直接承担损失”时的期望效用,
-就是本身你的财富-损失 右边是“买保险,损失被转移,但要付保费 P”时的确定效用,
-就是本身你的财富-保险 所以,P 就是该个体愿意为消除损失风险而支付的最高金额,使得两个方案的效用一样。
从保险公司/风险承担方(insurer)的角度:
左边是“收了保费 Q,面对赔付 Y 的不确定性”后的期望效用
-就是保险公司的财富+收了保费 -赔付 右边是“什么都不干,不收钱也不赔付”的原始效用;
-就是保险公司的财富所以,Q 就是保险公司至少要收的最低金额,保证自己不会因为承担风险而效用下降。
最大效能:
概率分布
Binomial random variable
期望:
方差:
$$Var(X)=np(1-p)$$
Poisson random variable
期望:
方差:
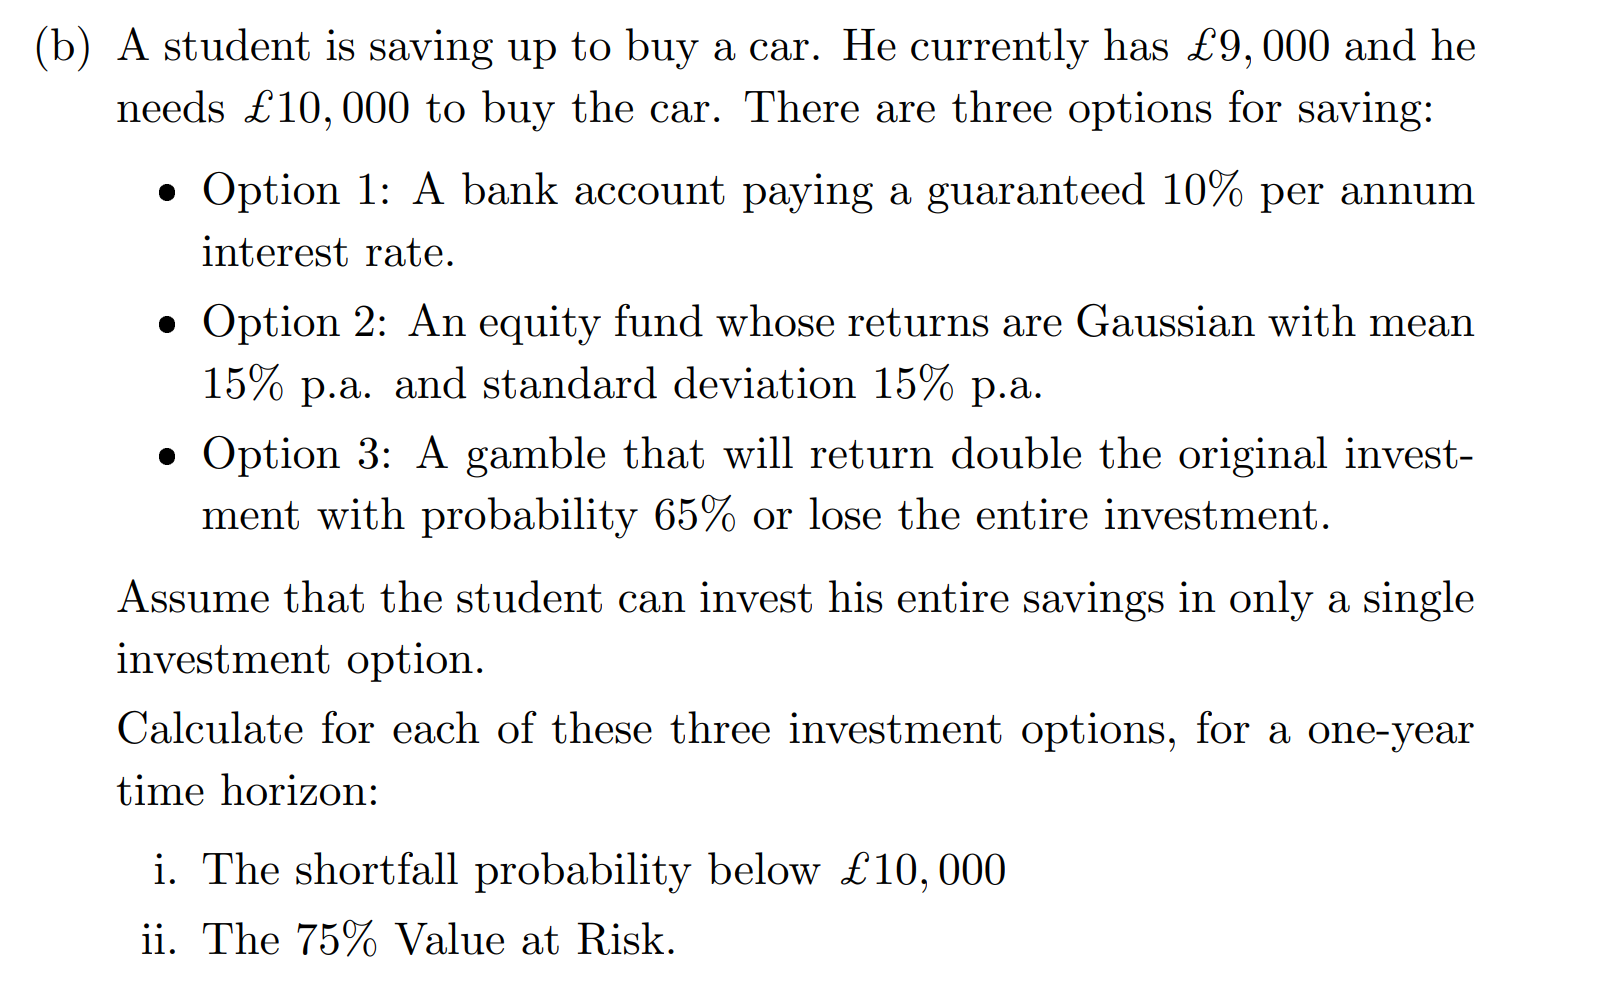
Risk measurements
A shortfall probability
A shortfall probability measures the probability of returns falling below a certain level. For continuous variables, the risk measure is given by:
semi-variance
One measure that seeks to quantify this view is downside semi-variance. This is defined as: Furthermore, if returns on assets are symmetrically distributed, semi-variance is proportional to variance.
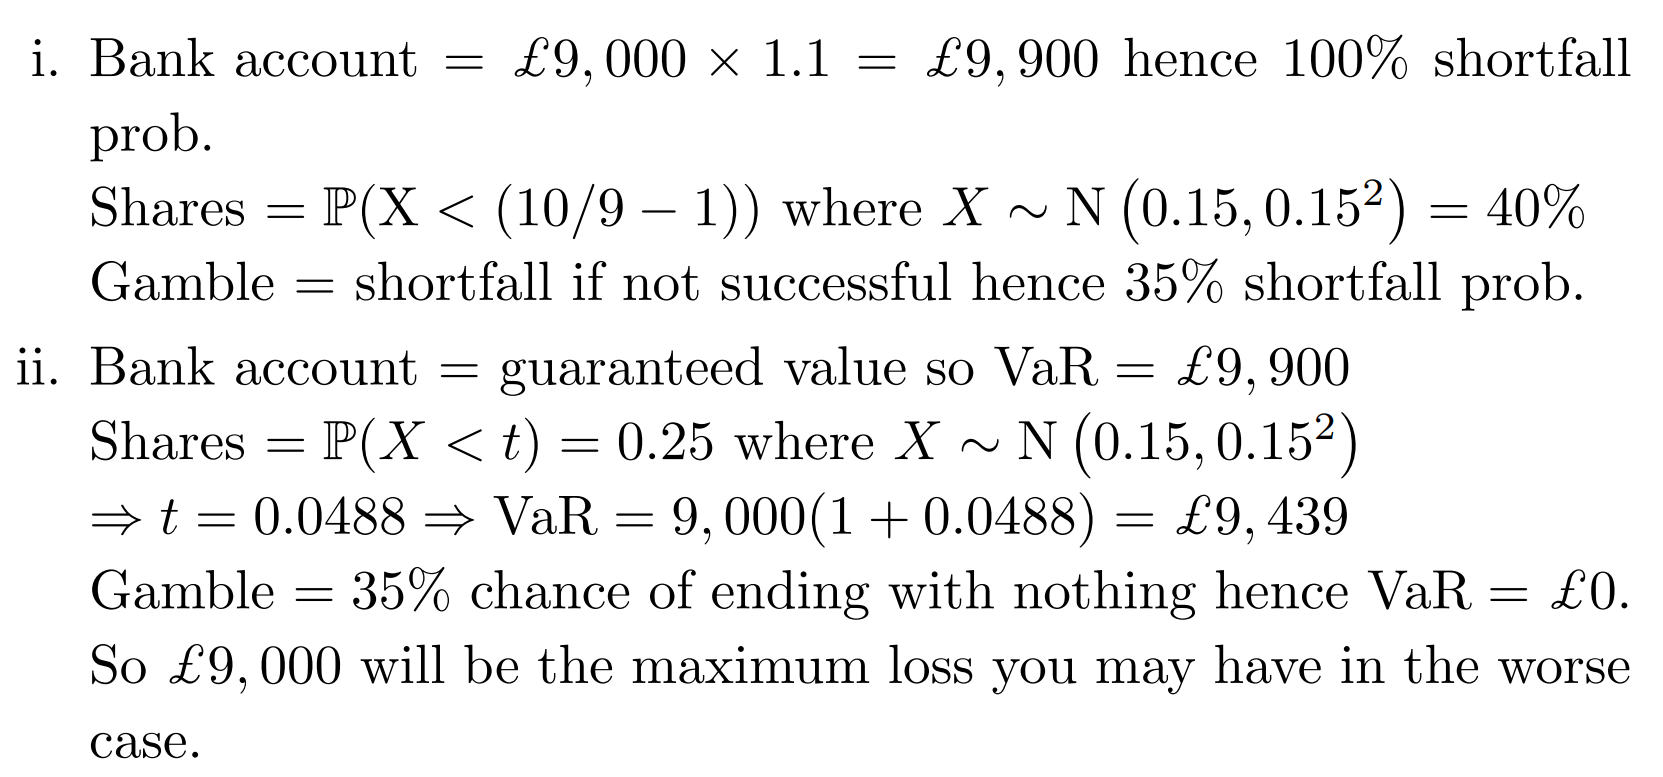
VaR
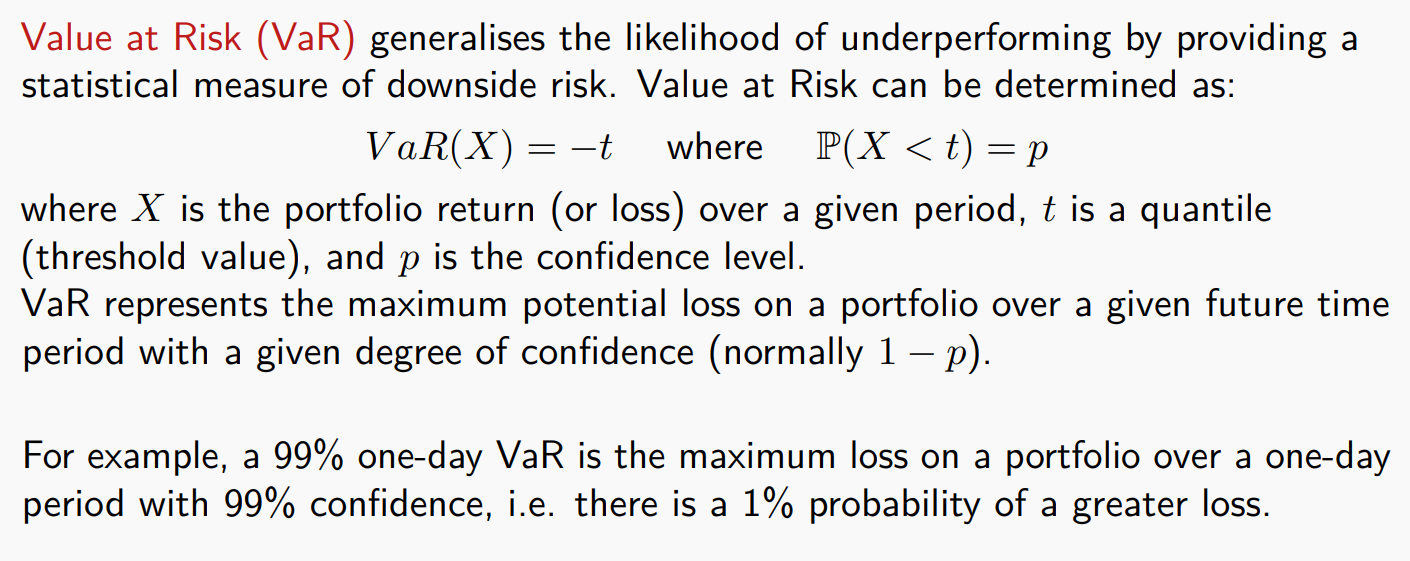
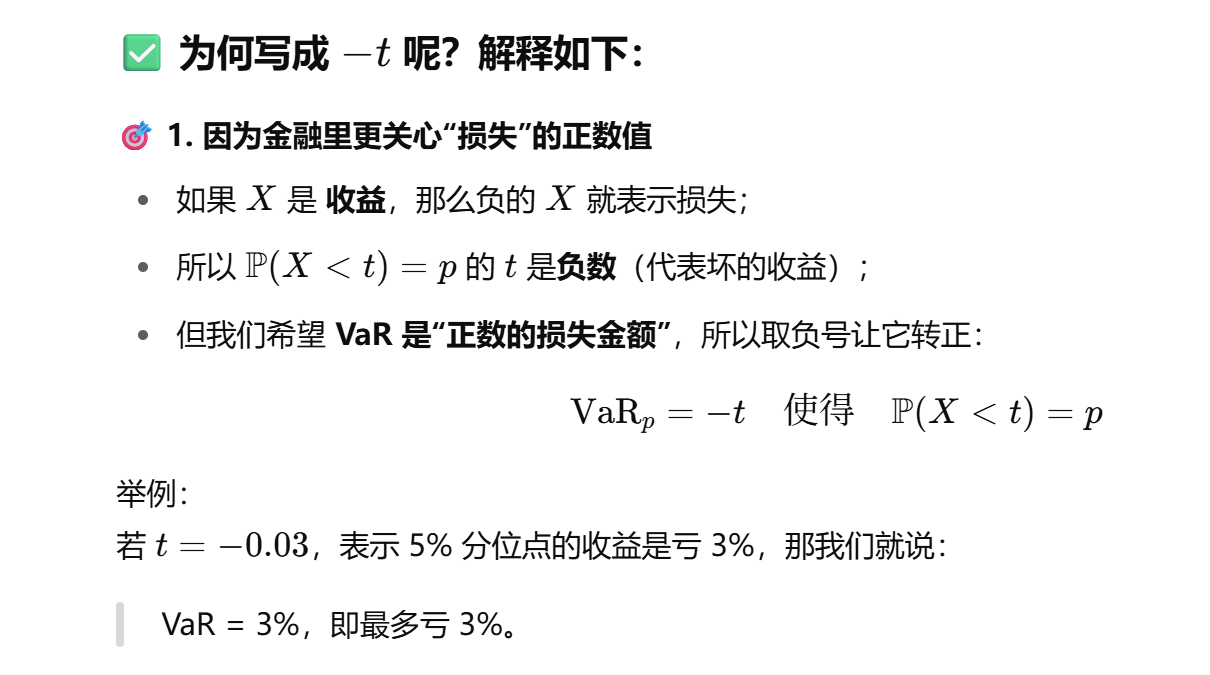
注意:

例题
The log-normal distribution
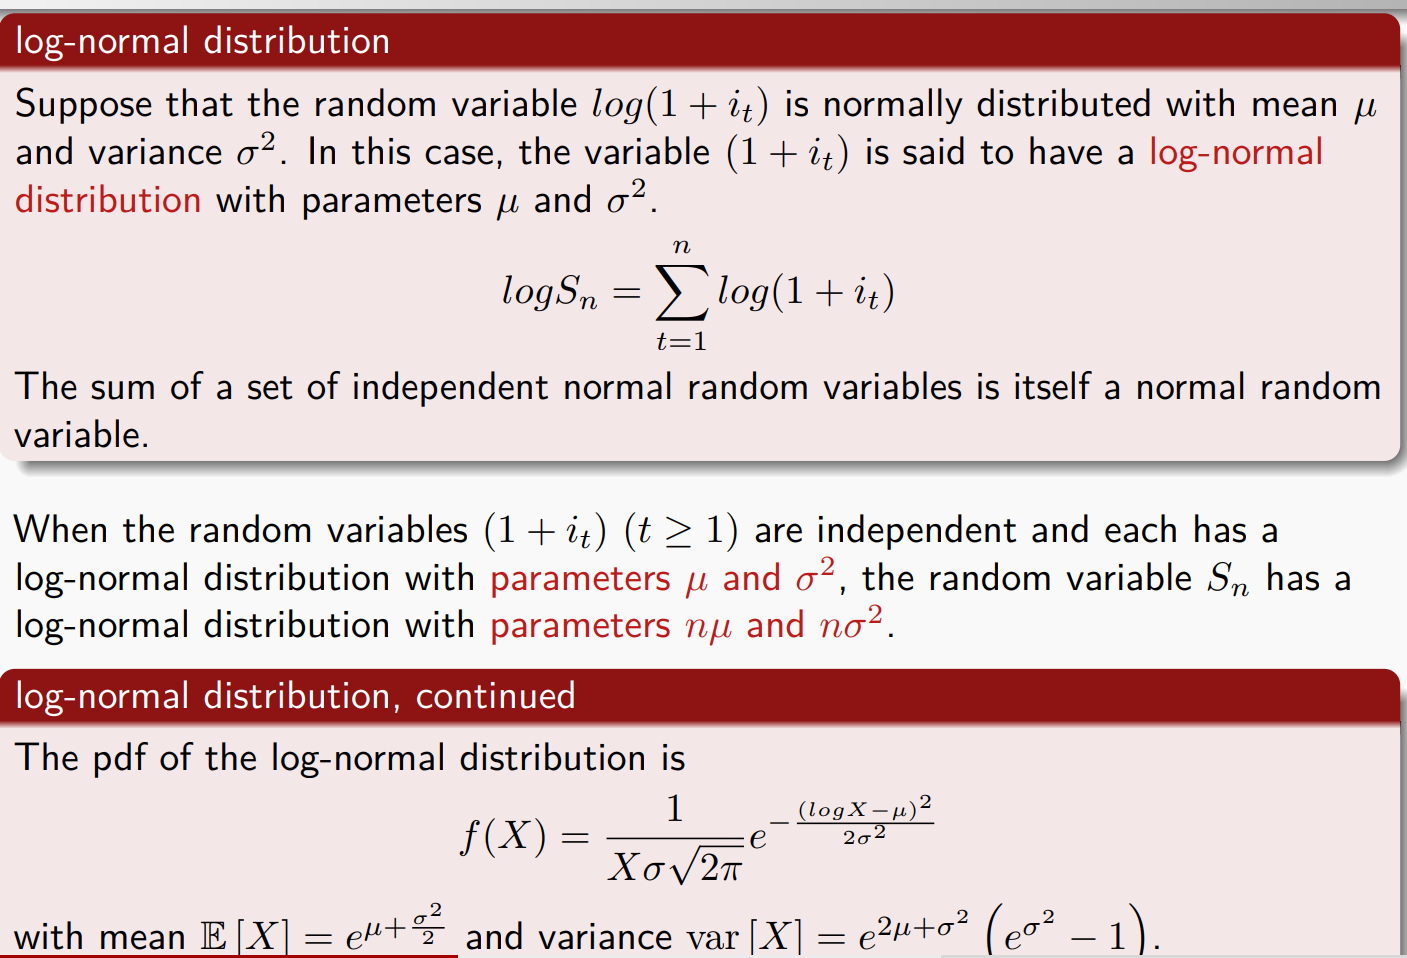
注意:两者参数一样但是含义不同:
正态分布的期望和方差:
$logX \sim \mathcal{N}(\mu, \sigma^2)$
log-normal的期望和方差:
$X \sim \mathcal{logN}(\mu, \sigma^2)$
考试技巧:
求解X的期望和方差时:
定义变量字母:
Stochastic investment returns
It follows from this equation that a single investment of 1 at time 0 will accumulate at time 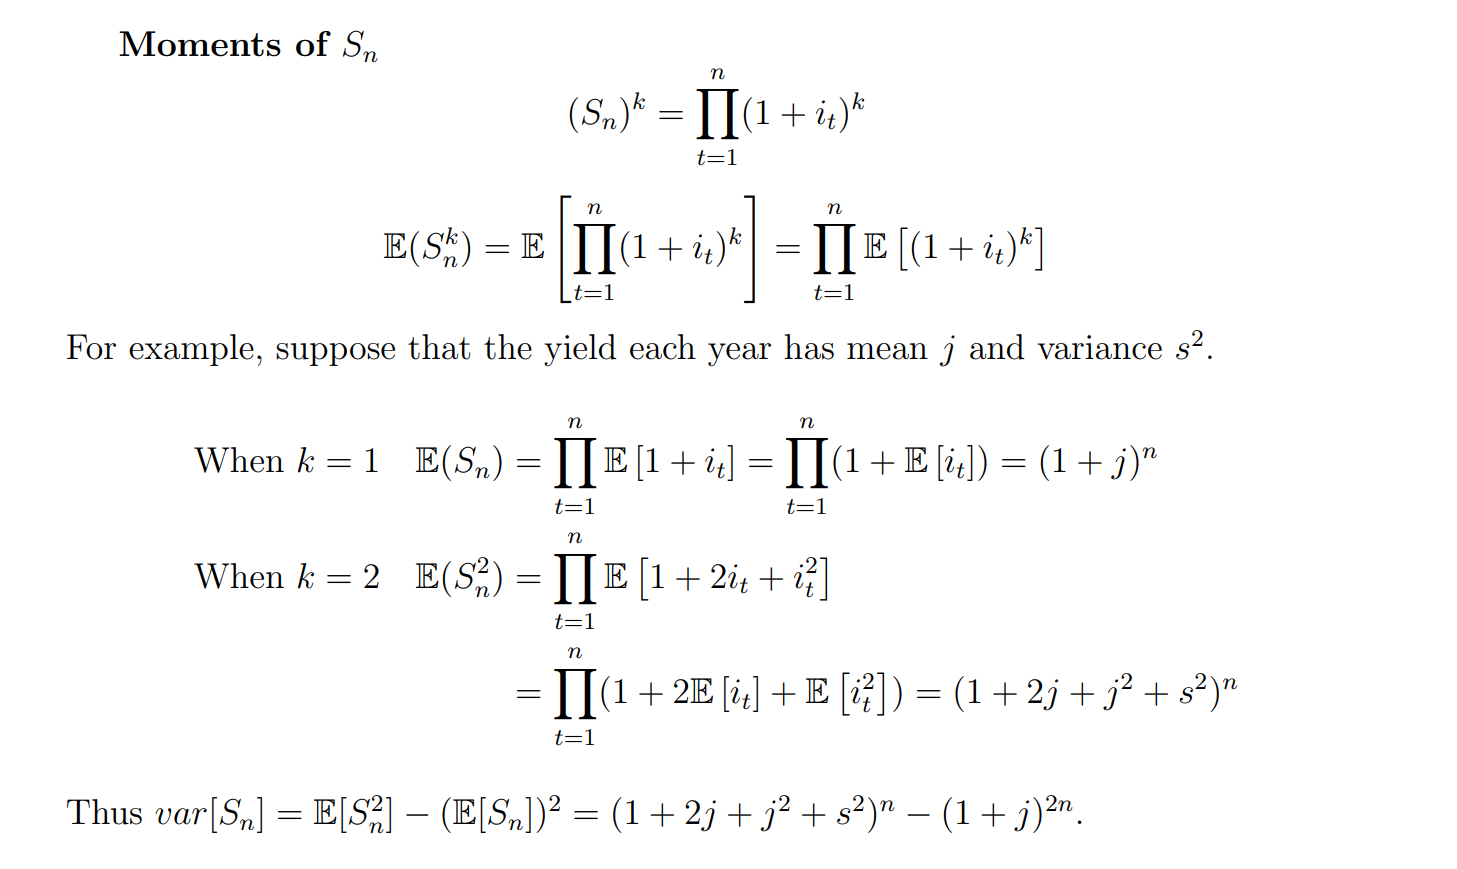
CAPM
SML :
表示的是一个「合理定价」的资产应该提供多少回报,作为其风险(β)的一种补偿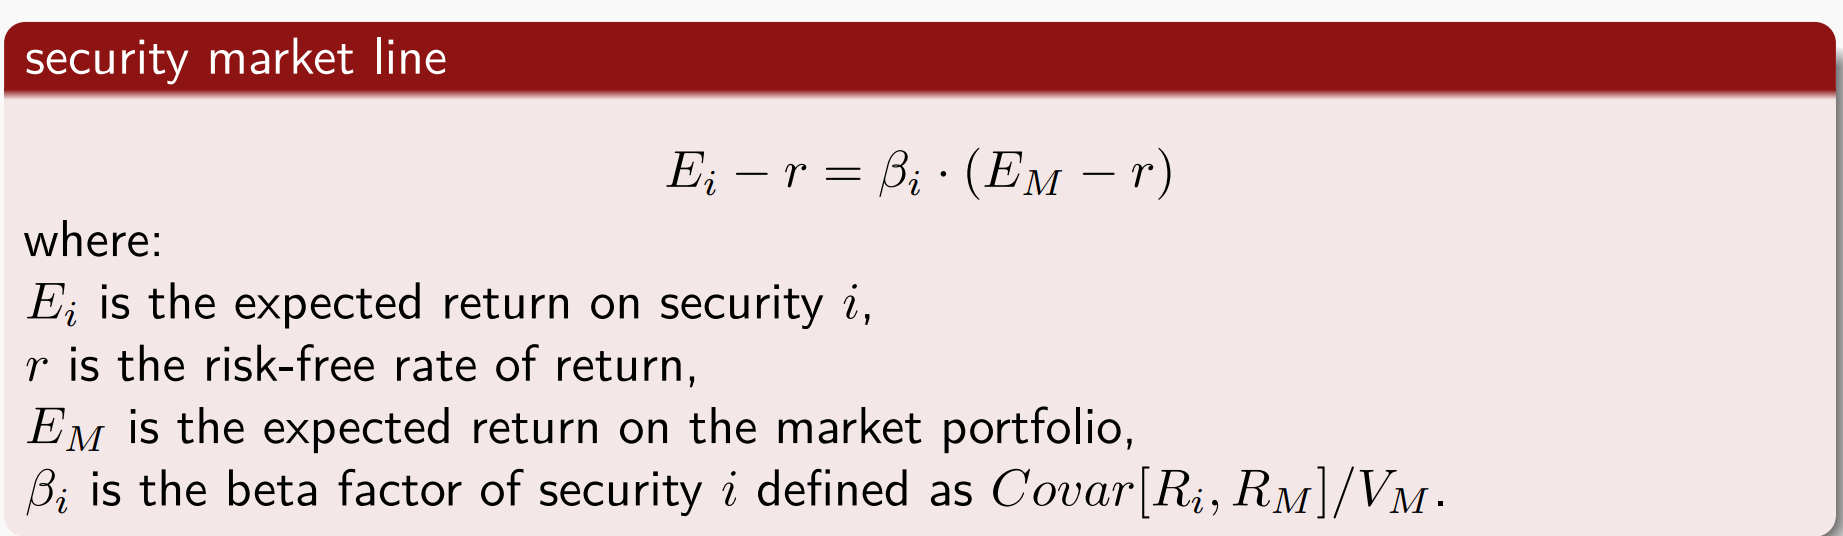
| 对象 | 含义 |
|---|---|
| 该资产无市场风险,只能获得无风险收益 |
|
| 该资产与市场一样波动,应该获得 |
|
| 风险高于市场,期望回报也应更高 | |
| 风险低于市场,期望回报也应更低 |
CAPM(资本资产定价模型)中市场组合的贝塔值恒为 1
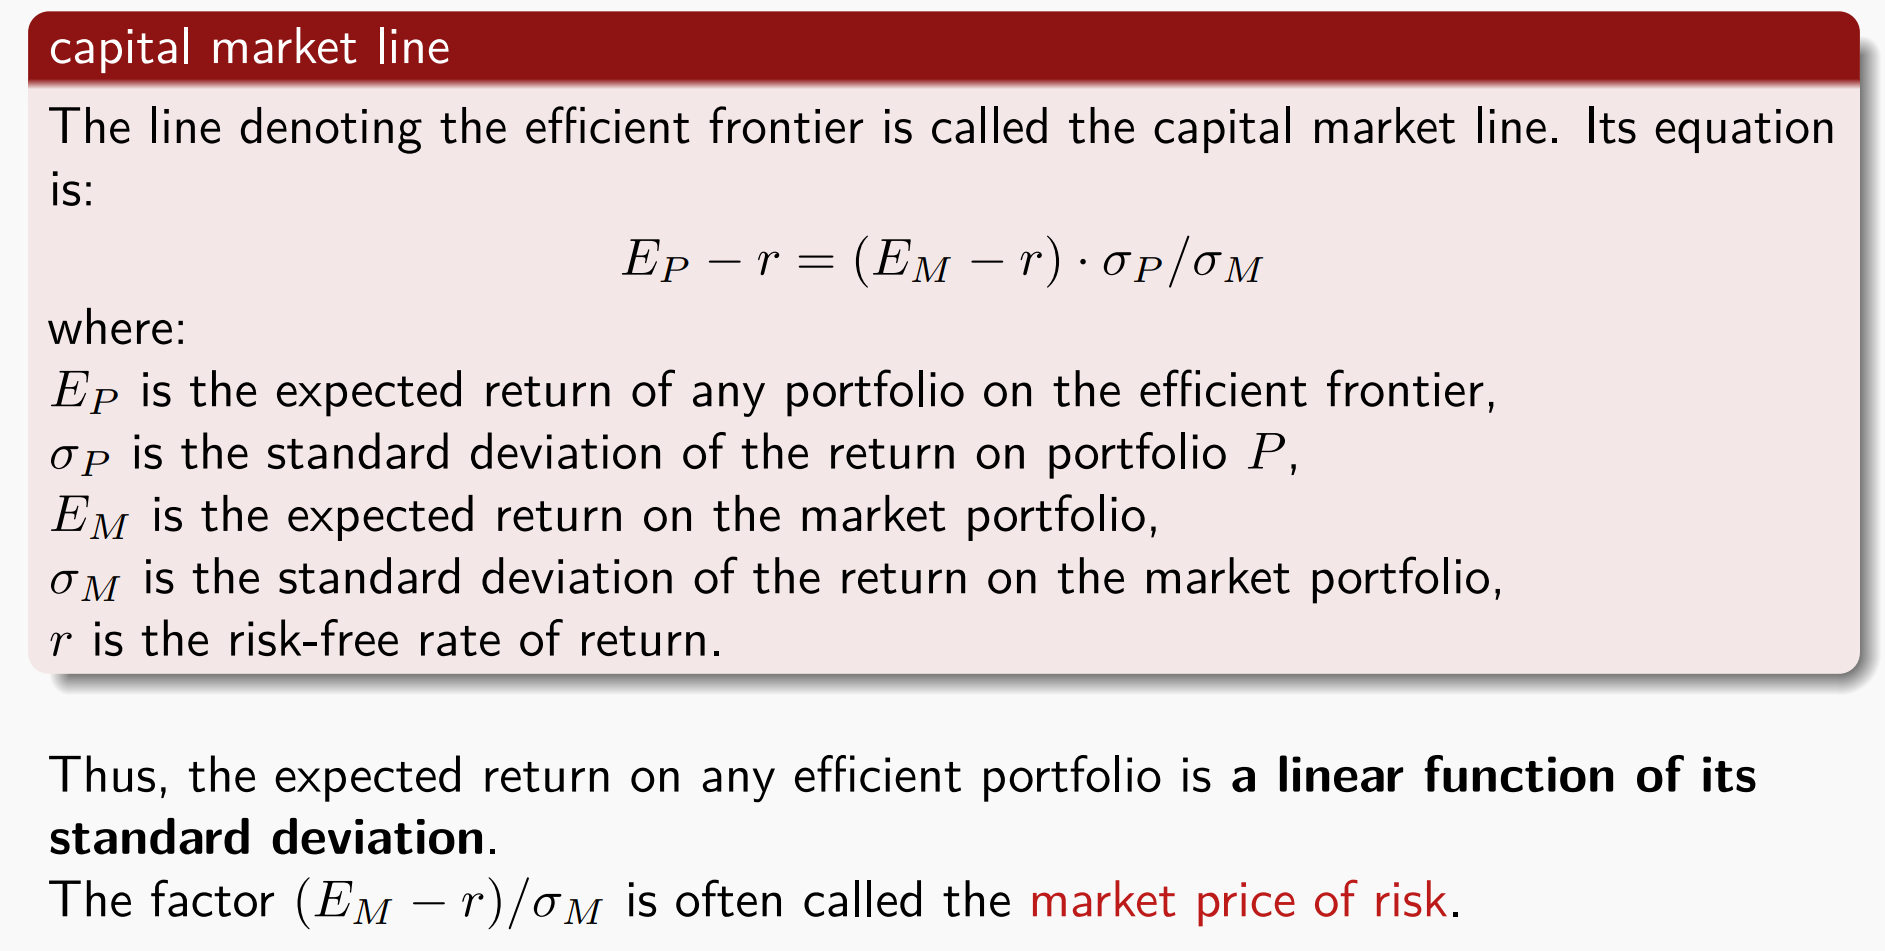
CML:
注意:
求解市场回报率的两种方法:
- 已知各各风险资产
的回报率,乘以资产占市场的比例 。 - 已知其中一种资产的回报率
还有其 值和无风险利率 。
夏普比(Sharpe Ratio)
夏普比(Sharpe Ratio)是金融中最常用的风险调整后收益指标,用来衡量投资每承担一单位风险所获得的超额回报。
定义:
其中:
:投资组合或资产的期望收益率 :无风险利率(risk-free rate) :该资产或组合收益率的标准差
Portfolio theory
The return on the portfolio,
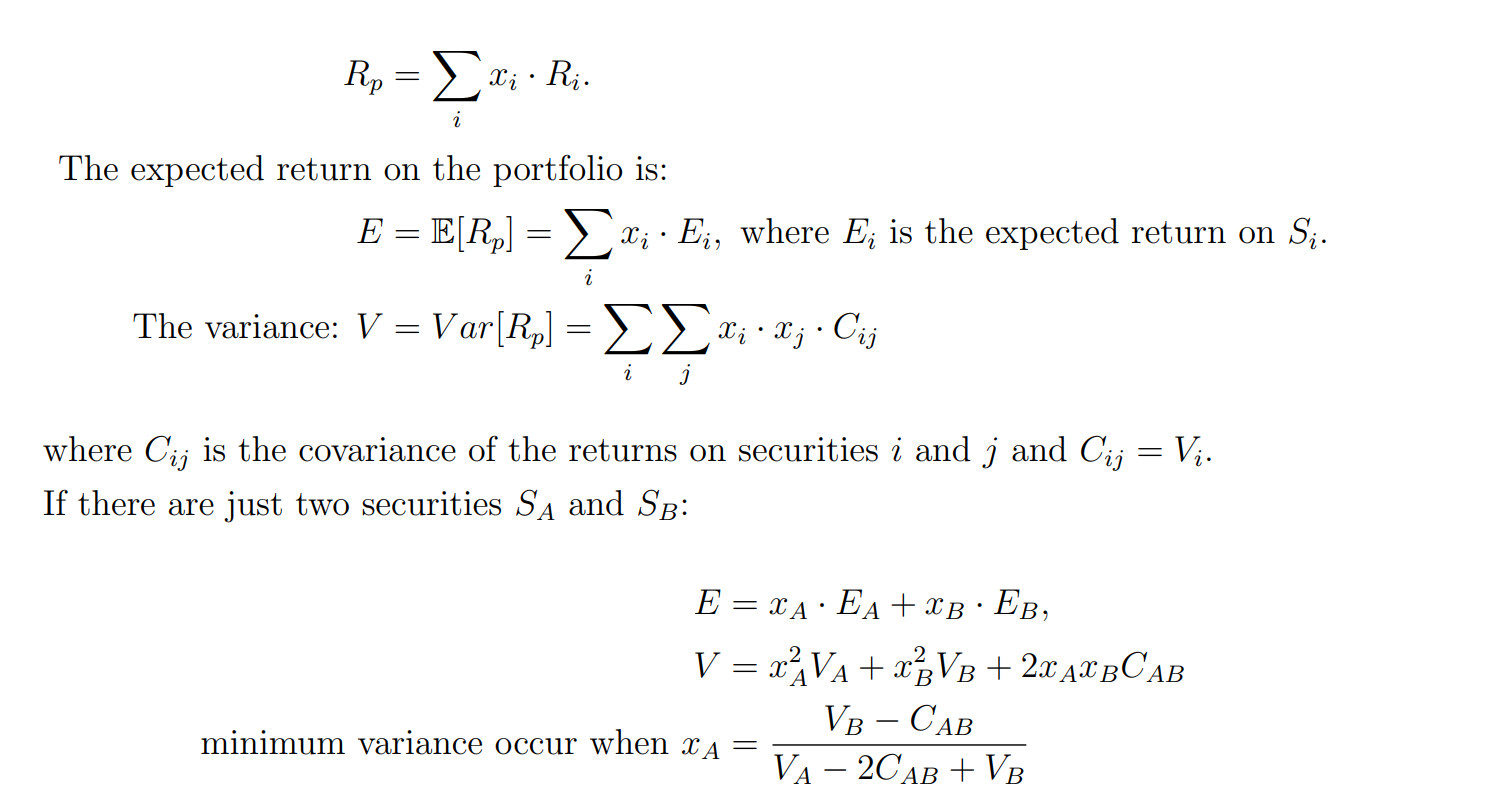
过程: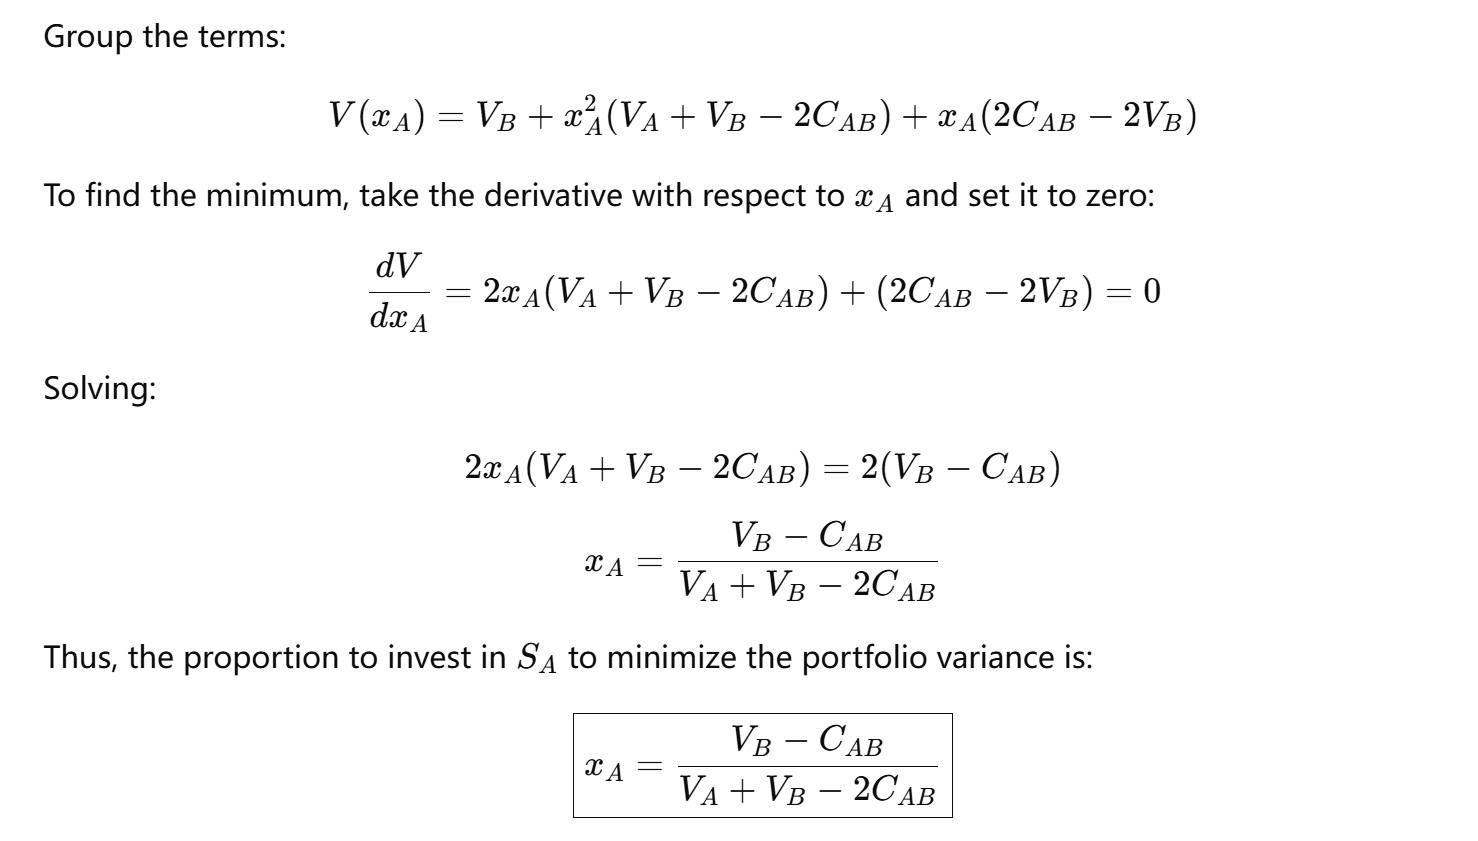
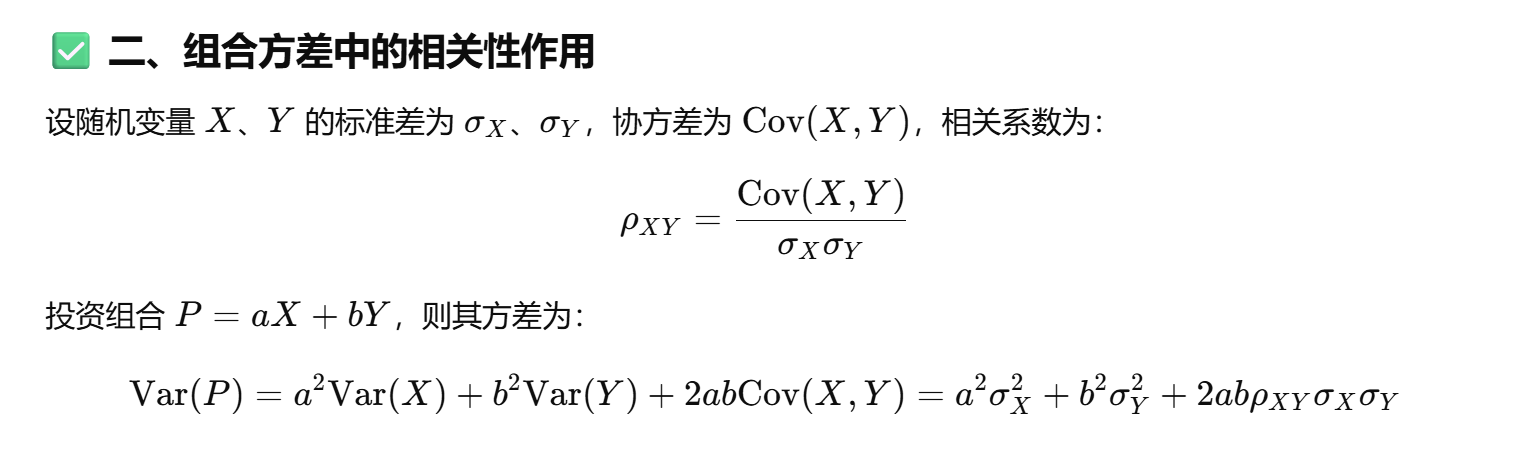
相关性和方差关系
有效前沿理论:
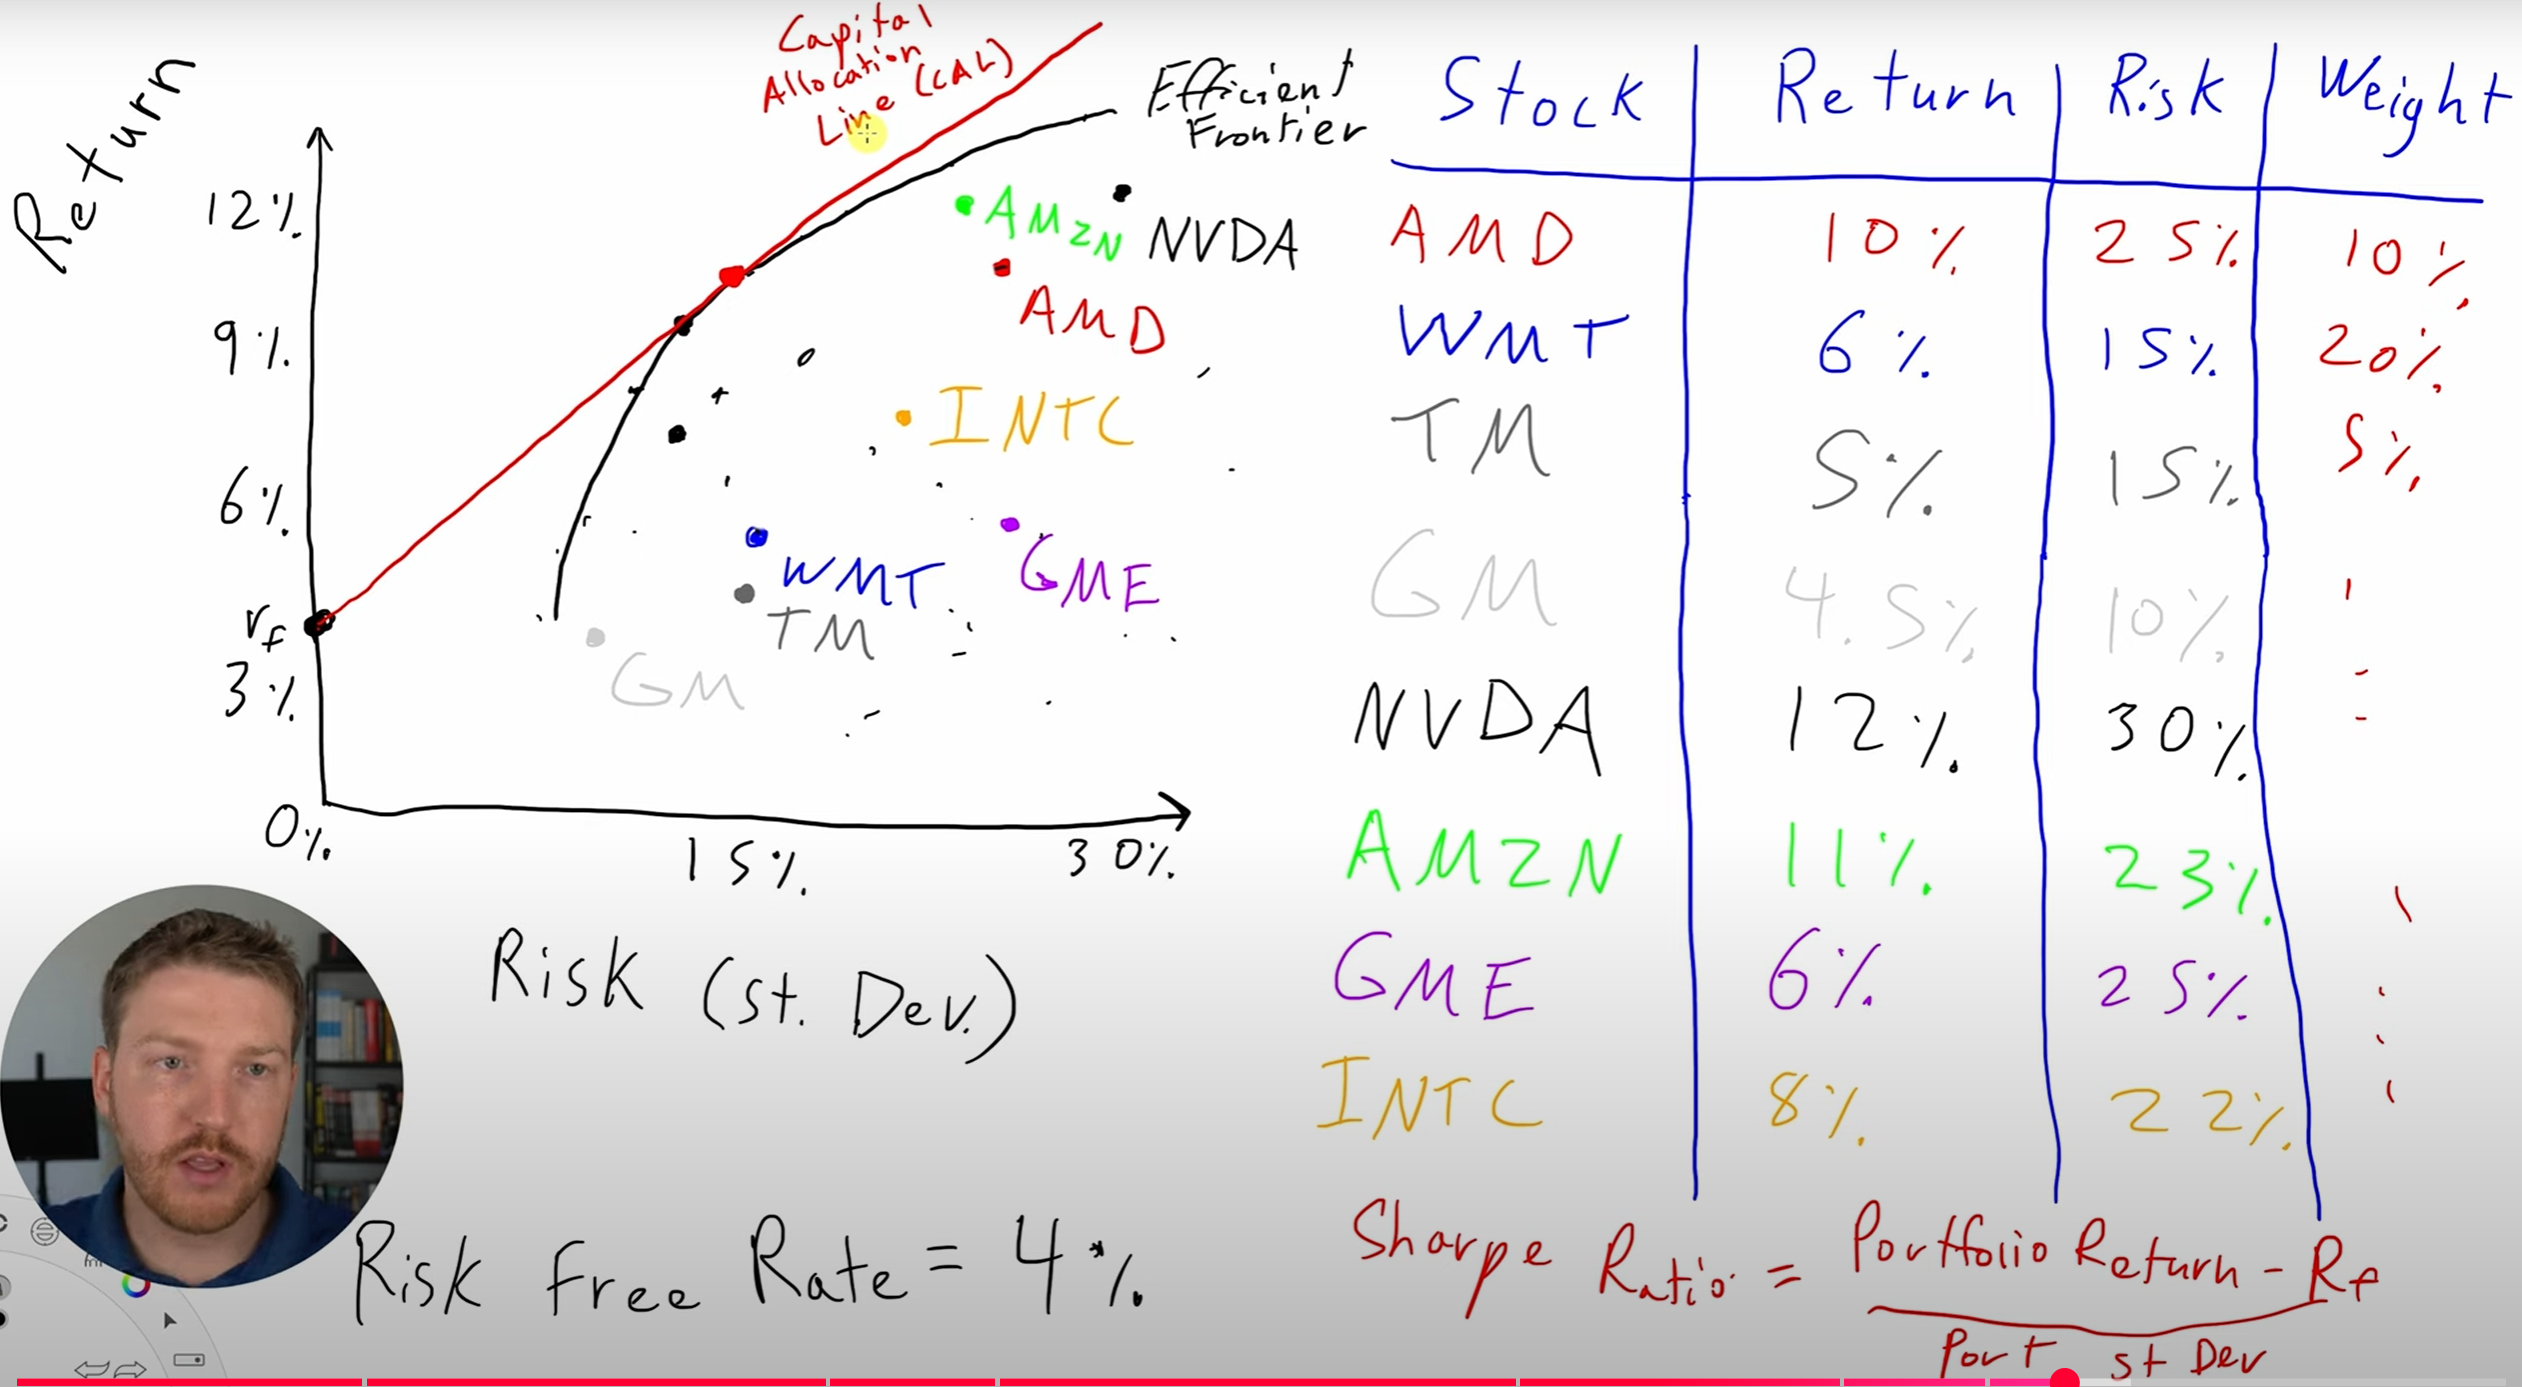
在二维图上,我们通常以投资组合的**标准差(风险)**为横轴、期望收益为纵轴绘制所有可能的资产组合点。由此得到的一系列最优组合形成一条向上的凸曲线,这条曲线即为“有效前沿”。它表示的是投资者理性地在不同风险偏好下可以选择的最优投资策略:
位于有效前沿上的组合是效率最优的,称为有效组合(Efficient Portfolio);
位于曲线下方的组合意味着在相同风险下有更高的收益可能,或者在相同收益下可以实现更低风险,因此是不理想的;
曲线的最左端点对应全市场风险最小的有效组合,即“最小方差组合”(Minimum Variance Portfolio);
若允许无风险资产加入,则所有投资组合的有效边界转化为一条从无风险资产切向有效前沿的资本市场线(Capital Market Line, CML)。
由于股票间存在相关性,所以组合大概率不是线性的,显示出来是曲线,如果相关性为1就可能是直线。