
Coefficient of determination and sample correlation coefficient
推导:
推导 1:
在简单线性回归模型中:
$$\hat{y}{i}=b{1}+b_{2}x_{i}
定义相关系数:
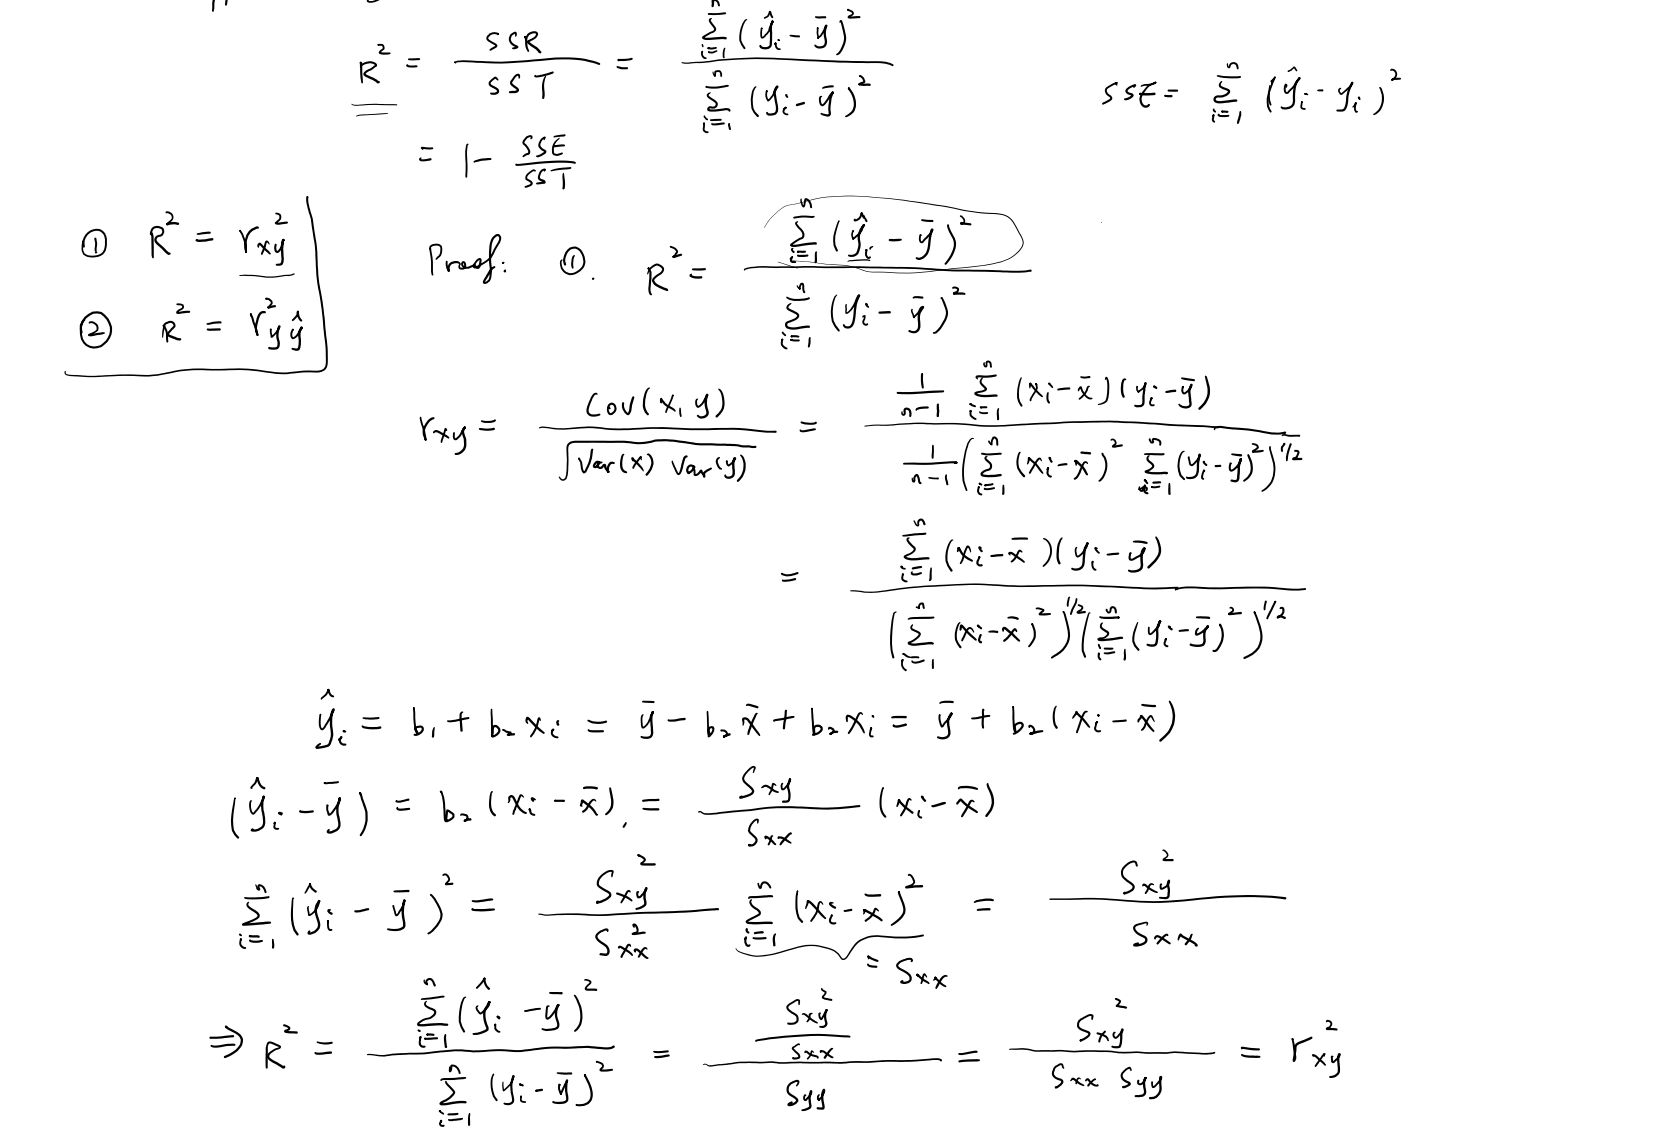
推导 2:
考虑一般线性回归(可能是多元):
相关系数定义为:
在 OLS 回归中,残差与预测值正交:
因此:
代入得:
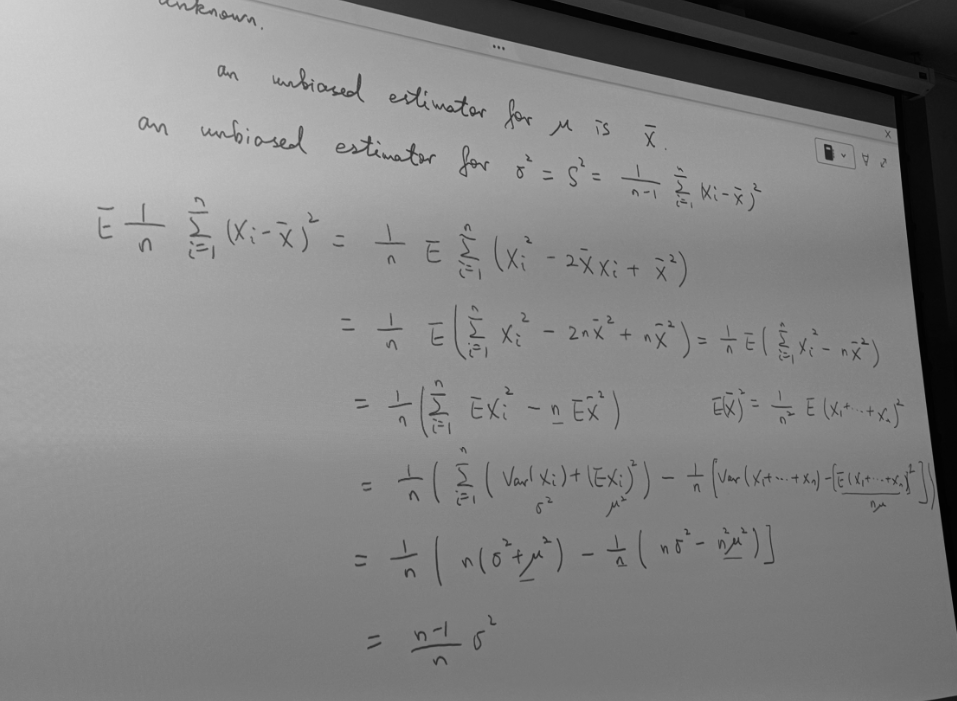
Estimating the variance of the error term
样本方差无偏性推导
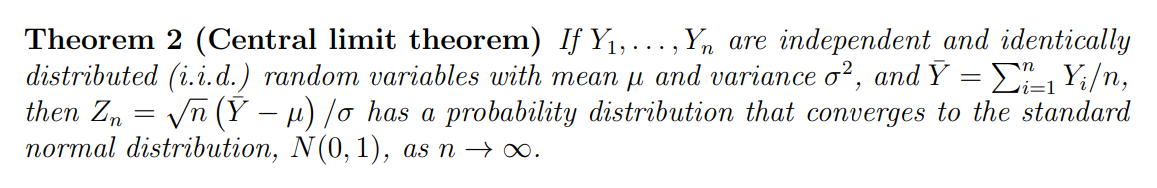
Estimators are not normally distributed
1. 两种情况
- 情况 A:假设误差
那么都是 的线性组合,而正态分布的线性组合仍然是正态。
所以此时可以直接得出:
情况 B:不假设
正态,只要求它们 i.i.d.,有有限方差
这时仍然是 的线性组合,但组合后的分布不一定正态。
不过,当 n 足够大时,可以用 中心极限定理 (CLT):样本均值或权重加权和会渐近趋向正态。于是得到这里的
就是“渐近正态”。
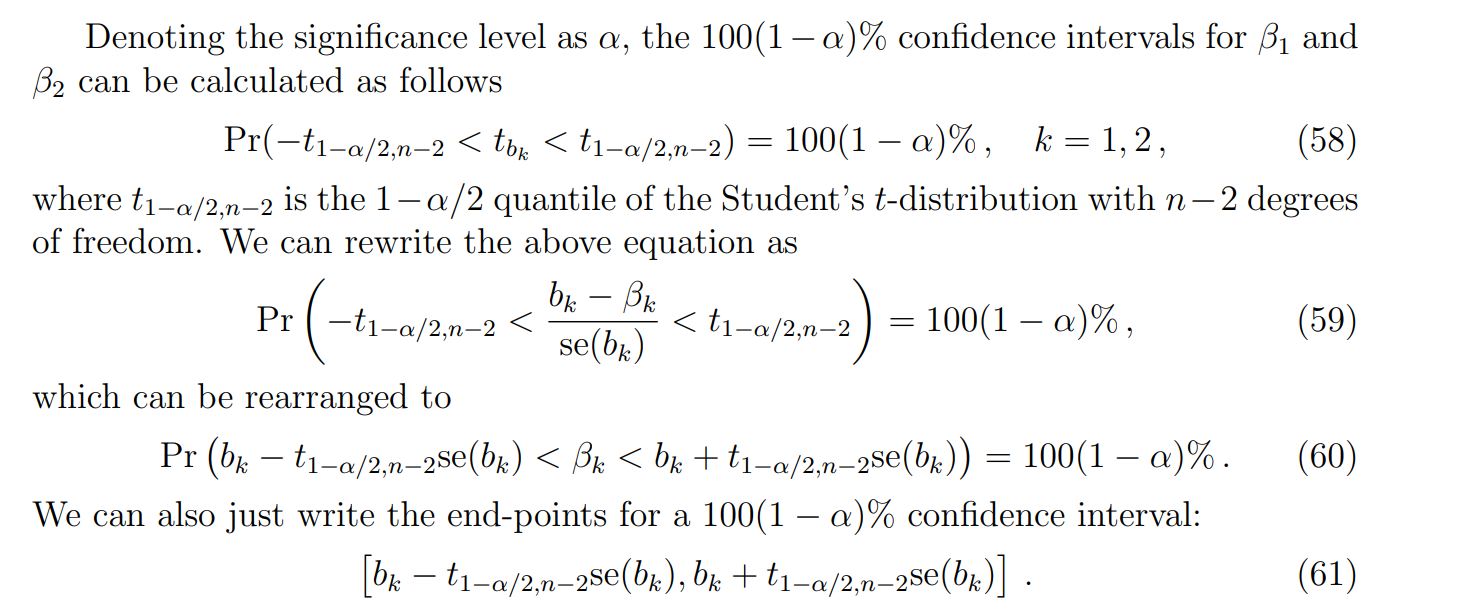
Confidence intervals for regression parameters
标准差 (Standard Deviation, SD) 和 标准误差 (Standard Error, SE) 的区别
SD 和 SE
定义层面
标准差 (SD)
衡量 数据本身 的离散程度。标准误差 (SE)
衡量 统计量(比如样本均值、回归系数)在重复抽样下的波动大小。它是“估计量的标准差”。
含义直观
SD:告诉你单个观测值一般离平均数有多远。
SE:告诉你估计出来的统计量(比如
)在不同样本之间会有多大差异。
求解置信区间
讨论:为什么是n-2自由度
**自由度 (degrees of freedom, df)
直观定义
自由度 = 可以自由变化的数据点个数 = 总数据点数 − 约束条件数。
例子:
有 n 个数,它们可以完全随意 → 自由度 = n。
但如果规定它们的和必须等于 0(加了 1 个约束) → 自由度 = n−1。
在回归里,估计了 k 个参数(k 个约束) → 残差自由度 = n−k。
数学定义
在统计学里,自由度通常指 统计量的分布所依赖的独立信息量。
比如:
卡方分布
的自由度就是平方和中独立正态变量的个数。 t 分布的自由度是
分母里的独立信息量。 回归中
的自由度就是“残差能自由变化的维度”。
t检验
回归分析的情形
模型背景:线性回归模型
检验命题:检验某个回归系数是否显著不为 0,例如
统计量:
$$ T = \frac{\hat{\beta}_j}{\operatorname{SE}(\hat{\beta}j)}, \quad T \sim t{n-k-1}.$$
- 自由度:因为我们估计了 k+1 个参数(截距 + k 个系数),所以剩下的自由度 = n−k−1。
单样本 t 检验
模型背景:只有一组样本
,总体均值 未知,总体方差也未知。 检验命题:检验总体均值是否等于某个假设值
,即 统计量:
自由度:因为估计了 1 个参数(样本均值
),所以自由度 = n-1 。
regression analysis output
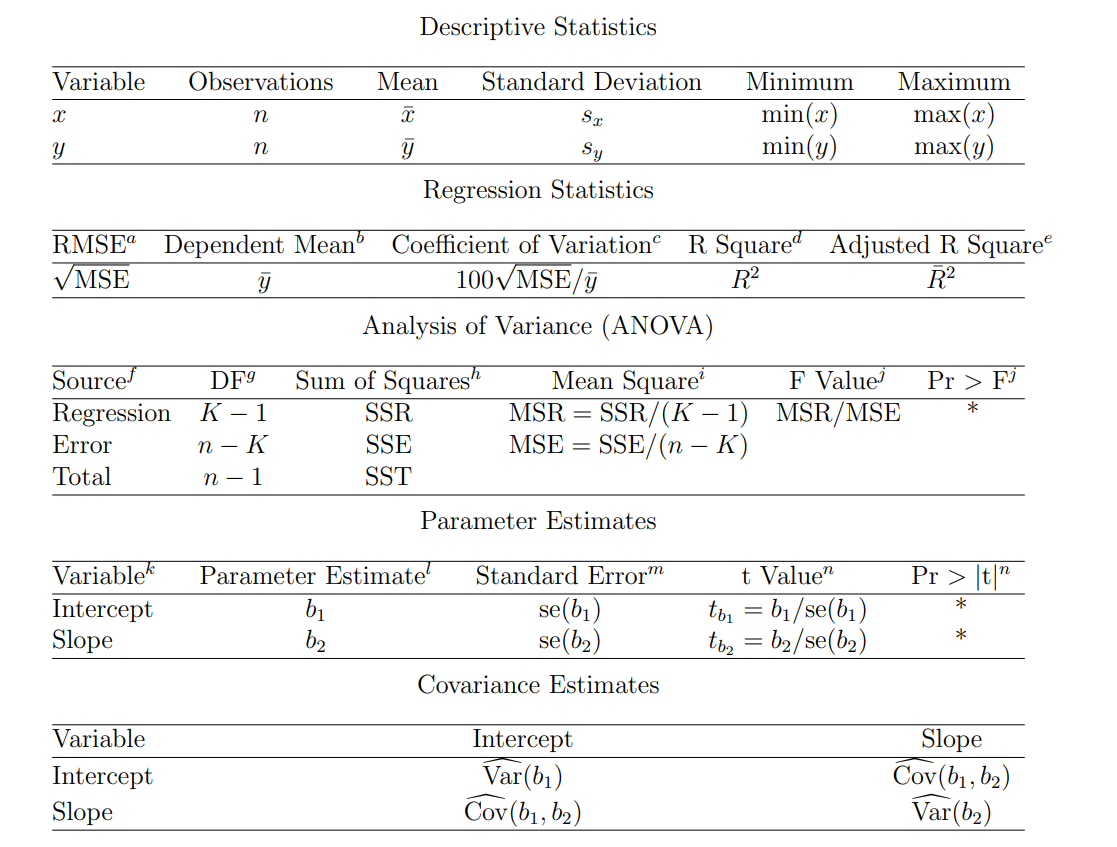
That is,
F Value
F Value and Pr > F: The p-values are used to answer the question “Do the explanatory variables reliably predict the dependent variable?”. The p-value is compared to your significance level (typically α = 0.05) and, if smaller, you can conclude “Yes, the explanatory variables reliably predict the dependent variable”. If the p-value is greater than the significance level, you would say that the group of explanatory variables does not show a statistically significant relationship with the dependent variable, or that the group of explanatory variables does not reliably predict the dependent variable. Note that this is an overall significance test assessing whether the group of explanatory variables when used together reliably predict the dependent variable, and does not address the ability of any of the particular explanatory variables to predict the dependent variable. The ability of each individual explanatory variable to predict the dependent variable is addressed in the table below where each of the individual variables are listed
简单总结:
F 检验:整体显著性 → 模型有没有解释力。
t 检验:局部显著性 → 哪个变量在起作用。
回归系数的标准误差(Standard Error, SE)
Standard Error: These are the standard errors associated with the parameter estimates. The standard error is used for testing whether the parameter is significantly different from 0 by dividing the parameter estimate by its associated standard error to obtain a test statistic (or t-value). The standard errors can also be used to form a confidence interval for the parameter.
定义
每个参数估计值都有一个抽样分布,因为我们是用样本数据来估计真实参数 。
标准误差(SE)就是这个抽样分布的标准差:作用
它衡量了估计值的不确定性:SE 越小,说明参数估计越稳定、越精确;SE 越大,说明估计结果波动性大,不稳定。检验统计量(t 值)
为了检验某个参数是否显著(通常是检验),我们计算 这个 t 值会服从近似的 t 分布(自由度 = n−k),然后和临界值或 p 值比较。
直观理解
如果 ∣t∣很大(意味着估计值远大于它的波动范围),就说明这个系数显著 ≠ 0。
如果 ∣t∣很小(估计值和噪声水平差不多),就说明没有显著证据认为这个系数 ≠ 0。
所以:
SE 反映参数估计的不确定性。
t 值 = 参数估计 ÷ 标准误差 → 用来做显著性检验。
回顾统计假设理论
p 值是什么?
p 值是:在零假设
α(显著性水平)是什么?
α 是事先设定的阈值(常用 0.05)。它表示我们最多愿意接受 5% 的错误拒绝
比较 p 和 α 的结论
如果 p < α → 说明这种极端结果在 H0H_0 下出现的概率太小,不合理 → 拒绝零假设。
如果 p ≥ α → 说明结果在 H0H_0 下还算合理 → 不能拒绝零假设(但不是“接受”,只是“没有足够证据拒绝”)。
关键点:为什么不是“接受” H0?
因为统计推断是基于有限样本的,我们没法证明 H0 真,只能说“目前的样本证据不足以否定 H0”。
所以严格的说法是:
拒绝 H0(p < α)
未能拒绝 H0(p ≥ α)